PROTECTED SOURCE SCRIPT
تم تحديثه N Pattern

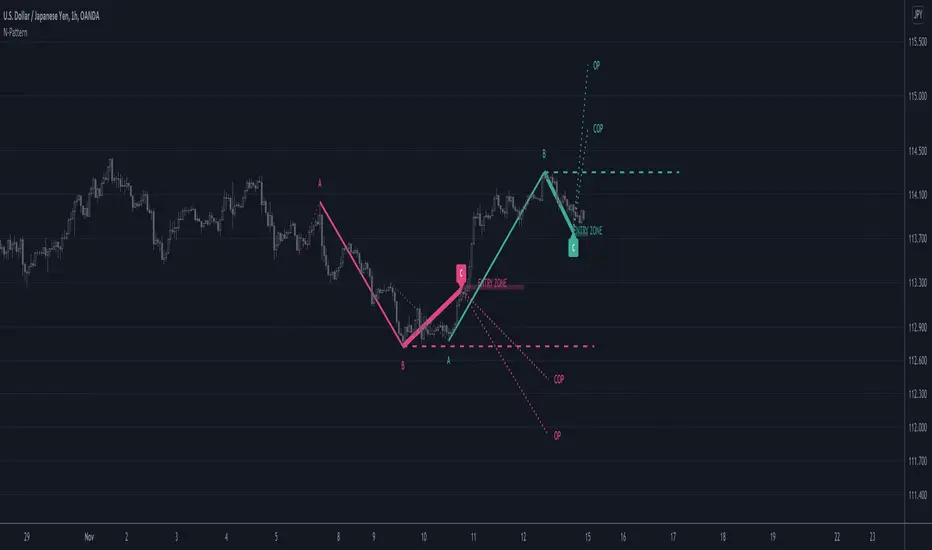
This indicator looks for N patterns on the chart and illustrates them.
It predicts the future point D from the most recent point C and the past points A and B.
Settings:
Pivot Right bar / Pivot Left bar
Pivot settings.
Lookback
Go back a specified number of bars to find point A.
When point A is found, the opposite vertex in between is point B.
Nearest Bars Count
If the most recent C point and the previous C point are too close, the previous C point will be hidden.
Specify the number of bars to determine if they are too close.
Objectives
There are three types of D points, which are future prices.
Each can be shown or hidden.
Support/Resistance
Draw a line extending horizontally from point B as a support line or resistance line.
ملاحظات الأخبار
Changed the option "nearest_count"0: All lines will be visible.
1: Lines with point A in common will be hidden.
2~: Lines with point C in the specified period will be hidden.
ملاحظات الأخبار
Changed the calculation of line lengths for support and resistance lines.It is calculated from the longer of the A-B and B-C periods.
ملاحظات الأخبار
- Added labels "OP" "COP" "XOP"
ملاحظات الأخبار
- Added P point.
ملاحظات الأخبار
Codes refactoringملاحظات الأخبار
- Migrated to pine script v5
- Updated the debug messages.
ملاحظات الأخبار
- Added C-P line
نص برمجي محمي
تم نشر هذا النص البرمجي كمصدر مغلق. ومع ذلك، يمكنك استخدامه بحرية ودون أي قيود - تعرف على المزيد هنا.
إخلاء المسؤولية
لا يُقصد بالمعلومات والمنشورات أن تكون، أو تشكل، أي نصيحة مالية أو استثمارية أو تجارية أو أنواع أخرى من النصائح أو التوصيات المقدمة أو المعتمدة من TradingView. اقرأ المزيد في شروط الاستخدام.