PROTECTED SOURCE SCRIPT
تم تحديثه ZTrend
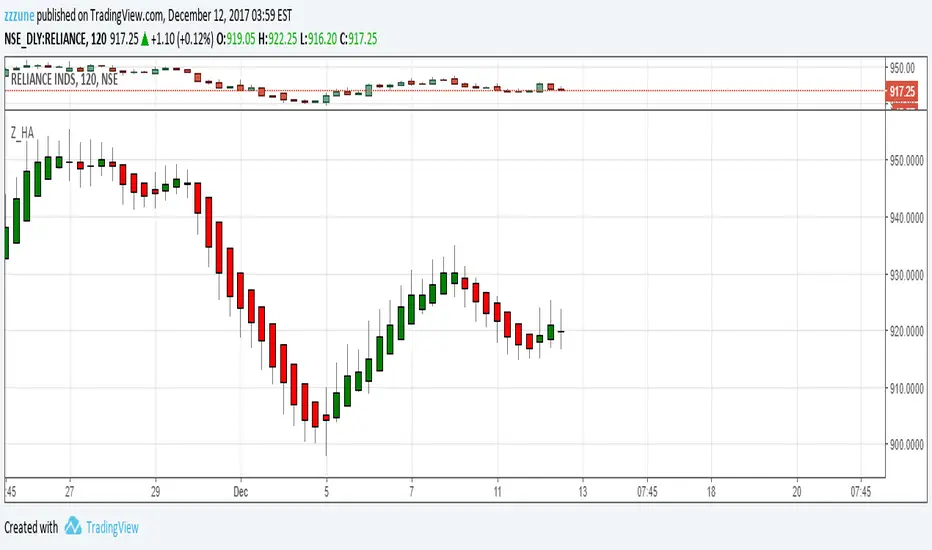
Pick Bottoms and Tops of a trend with ZTrend indicator. Use this indicator in multi frame for superb results.
If you are a Short Term trader, then use 2 hourly and Daily timeframe combination.
So after a downtrend, buy when 2 hourly candle turns green and wait until Daily candle also turns Green. Exit when 2 hourly candle turns red.
Ride the trend and do not exit until the 2 hourly candle turns Red.
When 2 consecutive candle body become thin, means end of a trend is near. Therefore either reduce the position or hedge.
Discipline is the key, therefore exit on the indication and do not wait in hope of marking turning your side.
ملاحظات الأخبار
study("ZTrend", shorttitle="Z_HA", overlay=false)O = ema(open,3)
H = ema(high,3)
L = ema(low,3)
C = ema(close,3)
haclose = (O + H + L + C) / 4
haopen = na(haopen[1]) ? (O + C) / 2 : (haopen[1] + haclose[1]) / 2
hahigh = max(H, max(haopen, haclose))
halow = min(L, min(haopen, haclose))
plotcandle(haopen, hahigh, halow, haclose, title='Mod_HA', color=(haopen < haclose) ? green : red, wickcolor=gray)
ملاحظات الأخبار
New update will plot ZTrend on the price chart itself.Use the Show/Hide button beside name of the instrument example show/Hide button just beside "NIFTY, 1D, NSE"
ملاحظات الأخبار
Actual closing price of each bar now is also plotted in light blue line. This will help give an indication where exactly the actual price is with respect to ZTrend bars.نص برمجي محمي
تم نشر هذا النص البرمجي كمصدر مغلق. ومع ذلك، يمكنك استخدامه بحرية ودون أي قيود - تعرف على المزيد هنا.
إخلاء المسؤولية
لا يُقصد بالمعلومات والمنشورات أن تكون، أو تشكل، أي نصيحة مالية أو استثمارية أو تجارية أو أنواع أخرى من النصائح أو التوصيات المقدمة أو المعتمدة من TradingView. اقرأ المزيد في شروط الاستخدام.
نص برمجي محمي
تم نشر هذا النص البرمجي كمصدر مغلق. ومع ذلك، يمكنك استخدامه بحرية ودون أي قيود - تعرف على المزيد هنا.
إخلاء المسؤولية
لا يُقصد بالمعلومات والمنشورات أن تكون، أو تشكل، أي نصيحة مالية أو استثمارية أو تجارية أو أنواع أخرى من النصائح أو التوصيات المقدمة أو المعتمدة من TradingView. اقرأ المزيد في شروط الاستخدام.