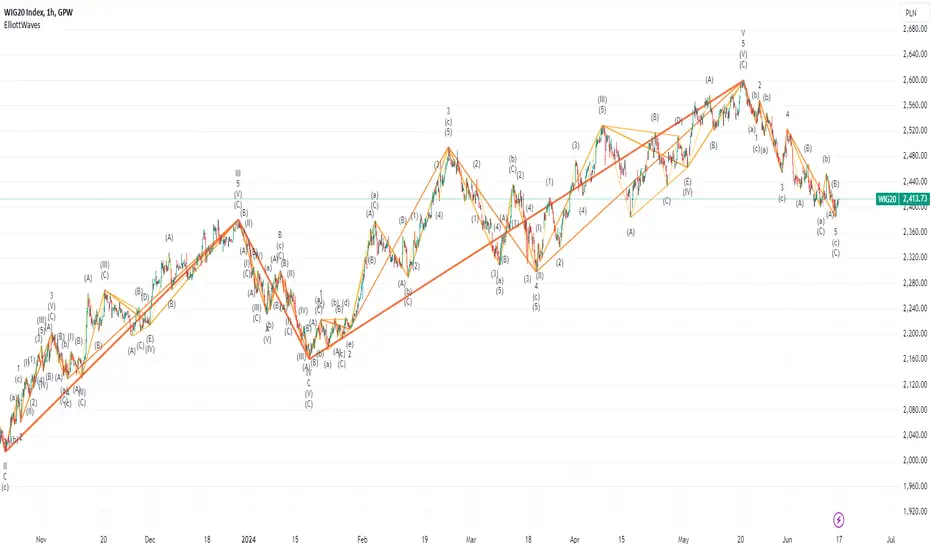
Elliot waves

This script can be used by any user. There is no need to have a PRO or PREMIUM account.
Script with limited access, contact author to get authorization
According to Elliott, a market cycle consists of eight waves. 5 upward waves and 3 downward waves following them, which are their corrections. In up and down movements, the odd waves are in the direction of the movement, and the even waves are their corrections. Analyzing in more detail, each direction movement again consists of 5 waves, and each correction consists of 3 waves.
The symbols used are non-standard (result of platform limitations):
Trend moves ⠀⠀⠀⠀⠀|⠀⠀Correction moves
𝐈 𝐈𝐈 𝐈𝐈𝐈 𝐈𝐕 𝐕 ⠀⠀⠀⠀⠀ |⠀⠀⠀ 𝐚 𝐛 𝐜
𝟏 𝟐 𝟑 𝟒 𝟓 ⠀⠀⠀⠀⠀⠀⠀|⠀⠀⠀ 𝐀 𝐁 𝐂
I II III IV V ⠀⠀⠀⠀⠀⠀⠀|⠀⠀⠀ a b c
1 2 3 4 5 ⠀⠀⠀⠀⠀⠀⠀ |⠀⠀⠀ A B C
(I) (II) (III) (IV) (V) ⠀ |⠀⠀⠀(a) (b) (c)
(1) (2) (3) (4) (5)⠀⠀ |⠀⠀⠀(A) (B) (C)
➀ ➁ ➂ ➃ ➄ ⠀⠀⠀⠀⠀ |⠀⠀⠀Ⓐ Ⓑ Ⓒ
❶ ❷ ❸ ❹ ❺ ⠀⠀⠀⠀⠀ |⠀⠀⠀🅐 🅑 🅒
This script is a part of the "Elliot waves" toolkit and require initial calibration done with separate script: "Elliot waves calibrator". Elliot waves calibrator will generate a set of numbers that you need to copy to Calibration params in script settings. Proper instruction will be shown on the screen.
Script settings:
Calibration - Fields used for script calibration.
Levels - Param deciding how many levels of waves should be shown on the chart. 0 is showing only the main waves, with +1 increase adding one more level of details.
Vertex filter - Filter eliminating highs and lows that are not an extreme over area width equal to vertex filter value.
8 sets of trend configurations, where you can specify: visiblity, line color, line width
Labels configuration where you can specify: visiblity, text size and text color.
Troubleshooting:
In case of any problems, please send error details to the author of the script.
-) Detecting triangles
-) Levels param was eliminated.
-) Improvements to calculation speed and many bug fixes
- Added max disproportion filter that can be used on price and time dimension
- Removed "%" option.
- Improved impuls detection.
- Many bugfixes
نص برمجي للمستخدمين المدعوين فقط
يمكن فقط للمستخدمين الذين تمت الموافقة عليهم من قبل المؤلف الوصول إلى هذا البرنامج النصي. ستحتاج إلى طلب الإذن والحصول عليه لاستخدامه. يتم منح هذا عادةً بعد الدفع. لمزيد من التفاصيل، اتبع تعليمات المؤلف أدناه أو اتصل ب Investor_R مباشرة.
لا توصي TradingView بالدفع مقابل برنامج نصي أو استخدامه إلا إذا كنت تثق تمامًا في مؤلفه وتفهم كيفية عمله. يمكنك أيضًا العثور على بدائل مجانية ومفتوحة المصدر في نصوص مجتمعنا.
تعليمات المؤلف
More details on Website and Youtube.
إخلاء المسؤولية
نص برمجي للمستخدمين المدعوين فقط
يمكن فقط للمستخدمين الذين تمت الموافقة عليهم من قبل المؤلف الوصول إلى هذا البرنامج النصي. ستحتاج إلى طلب الإذن والحصول عليه لاستخدامه. يتم منح هذا عادةً بعد الدفع. لمزيد من التفاصيل، اتبع تعليمات المؤلف أدناه أو اتصل ب Investor_R مباشرة.
لا توصي TradingView بالدفع مقابل برنامج نصي أو استخدامه إلا إذا كنت تثق تمامًا في مؤلفه وتفهم كيفية عمله. يمكنك أيضًا العثور على بدائل مجانية ومفتوحة المصدر في نصوص مجتمعنا.
تعليمات المؤلف
More details on Website and Youtube.