OPEN-SOURCE SCRIPT
MACD with Candle Display
MACD Calculation:
Uses user-defined Fast Length, Slow Length, and Signal Smoothing parameters to compute MACD.
Supports SMA (Simple Moving Average) or EMA (Exponential Moving Average) for the MACD line and signal line
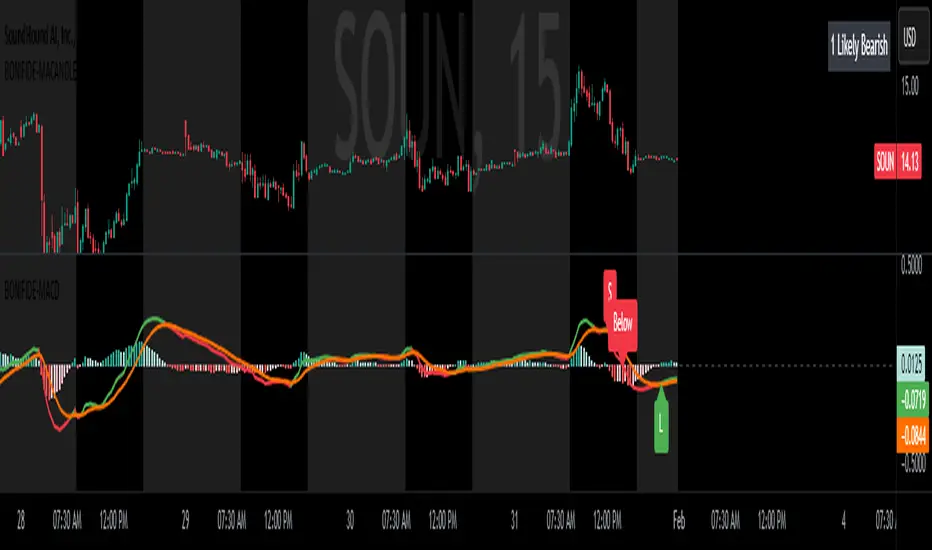
Histogram-Based Candle Coloring:
The script categorizes histogram bars into four states:
0 (Very Bullish) → Green
1 (Likely Bearish) → Blue
2 (Likely Bullish) → Orange
3 (Very Bearish) → Red
Histogram Plot:
Displays histogram bars with distinct colors based on price momentum changes.
Market Sentiment Display in Status Line & Price Scale:
Instead of adding a label on the chart (which could obstruct candles), a text display is shown in the price scale and status line:
"0 Very Bullish"
"1 Likely Bearish"
"2 Likely Bullish"
"3 Very Bearish"
The text appears in the top-right corner with white font on a black background.
Purpose:
This indicator enhances the standard MACD by incorporating candle coloring and a cleaner sentiment display in the price scale, helping traders quickly interpret market momentum without cluttering the chart.
Uses user-defined Fast Length, Slow Length, and Signal Smoothing parameters to compute MACD.
Supports SMA (Simple Moving Average) or EMA (Exponential Moving Average) for the MACD line and signal line
Histogram-Based Candle Coloring:
The script categorizes histogram bars into four states:
0 (Very Bullish) → Green
1 (Likely Bearish) → Blue
2 (Likely Bullish) → Orange
3 (Very Bearish) → Red
Histogram Plot:
Displays histogram bars with distinct colors based on price momentum changes.
Market Sentiment Display in Status Line & Price Scale:
Instead of adding a label on the chart (which could obstruct candles), a text display is shown in the price scale and status line:
"0 Very Bullish"
"1 Likely Bearish"
"2 Likely Bullish"
"3 Very Bearish"
The text appears in the top-right corner with white font on a black background.
Purpose:
This indicator enhances the standard MACD by incorporating candle coloring and a cleaner sentiment display in the price scale, helping traders quickly interpret market momentum without cluttering the chart.
نص برمجي مفتوح المصدر
بروح TradingView الحقيقية، قام مبتكر هذا النص البرمجي بجعله مفتوح المصدر، بحيث يمكن للمتداولين مراجعة وظائفه والتحقق منها. شكرا للمؤلف! بينما يمكنك استخدامه مجانًا، تذكر أن إعادة نشر الكود يخضع لقواعد الموقع الخاصة بنا.
إخلاء المسؤولية
لا يُقصد بالمعلومات والمنشورات أن تكون، أو تشكل، أي نصيحة مالية أو استثمارية أو تجارية أو أنواع أخرى من النصائح أو التوصيات المقدمة أو المعتمدة من TradingView. اقرأ المزيد في شروط الاستخدام.