SENTIMENTSENTIMENT Indicator – User Guide
Summary
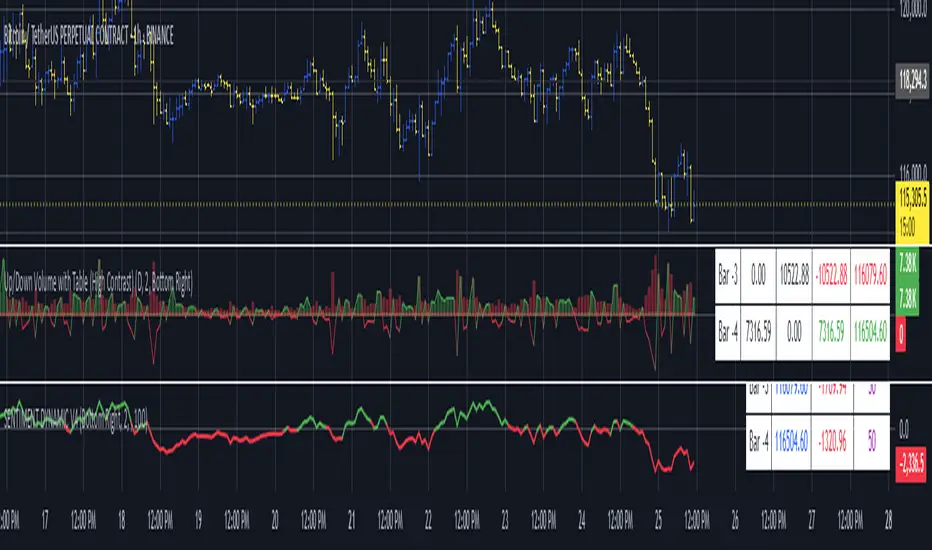
The SENTIMENT indicator provides a quick visual reference for current and recent market sentiment. It compares the closing price to a custom sentiment value, which is the average of the 100-period (default) simple moving averages (SMA) of the high and low prices. The indicator displays this information in a color-coded table and plots the difference between price and sentiment as a line on your chart.
How to Use
1. Table Overview
The table appears on your chart in your chosen position.
It displays four rows: the current bar (“Now”) and the previous three bars (“Bar -1”, “Bar -2”, “Bar -3”).
Each row shows:
The bar label (The current bar is live and active, constantly changing)
The closing price for that bar
The difference between the closing price and the sentiment value for that bar
The sentiment difference is color-coded:
Green: Price is above sentiment (bullish)
Red: Price is below sentiment (bearish)
2. Chart Plot
The indicator plots a line showing the difference between the current price and the sentiment value.
When the line is above zero: price is above sentiment (bullish).
When the line is below zero: price is below sentiment (bearish).
3. Settings
Number of Lookback Bars: Adjusts the SMA period for sentiment calculation (default is 100).
Table Position: Choose where to display the table on your chart (e.g., Top Left, Bottom Right).
How to Interpret
Green values in the table or a plot above zero suggest bullish sentiment.
Red values in the table or a plot below zero suggest bearish sentiment.
Use this indicator to quickly assess if the market is trading above or below its recent average sentiment level.
Tips
You can combine the SENTIMENT indicator with other tools or signals for more robust trading decisions.
Adjust the lookback period to suit your trading timeframe and style.
مؤشرات اتساع النطاق
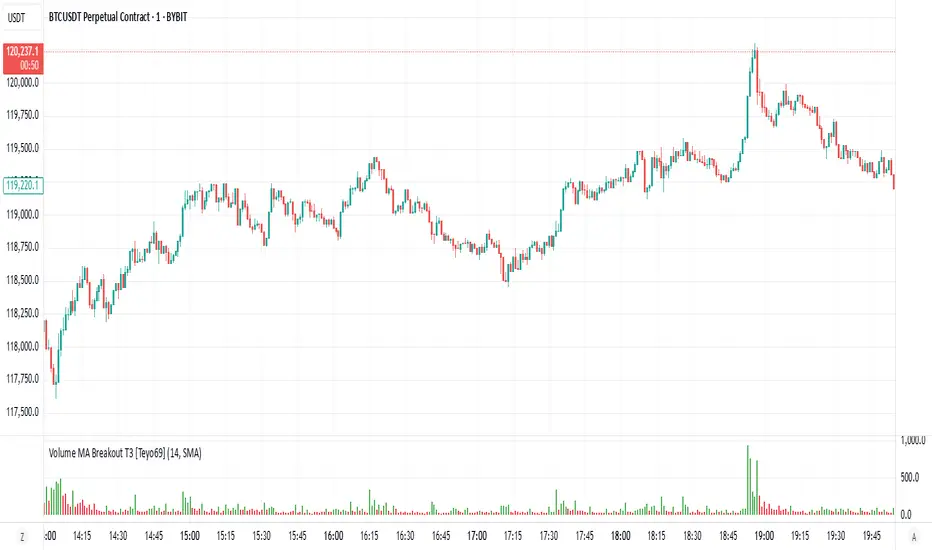
Volume MA Breakout T3 [Teyo69]🧭 Overview
Volume MA Breakout T3 highlights volume bars that exceed a dynamic moving average threshold. It helps traders visually identify volume breakouts—periods of significant buying or selling pressure—based on user-selected MA methods (SMA, EMA, DEMA).
🔍 Features
Volume Highlighting: Green bars indicate volume breakout above the MA; red bars otherwise.
Custom MA Options: Choose between SMA, EMA, or Double EMA for volume smoothing.
Dynamic Threshold: The moving average line adjusts based on user-defined length and method.
⚙️ Configuration
Length: Number of bars used for the moving average calculation (default: 14).
Method: Type of moving average to use:
"SMA" - Simple Moving Average
"EMA" - Exponential Moving Average
"Double EMA" - Double Exponential Moving Average
📈 How to Use
Apply to any chart to visualize volume behavior relative to its MA.
Look for green bars: These suggest volume is breaking out above its recent average—potential signal of momentum.
Red bars indicate normal/subdued volume.
⚠️ Limitations
Does not provide directional bias—use with price action or trend confirmation tools.
Works best with additional context (e.g., support/resistance, candle formations).
🧠 Advanced Tips
Use shorter MAs (e.g., 5–10) in volatile markets for more responsive signals.
Combine with OBV, MFI, or accumulation indicators for confluence.
📌 Notes
This is a volume-based filter, not a signal generator.
Useful for breakout traders and volume profile enthusiasts.
📜 Disclaimer
This script is for educational purposes only. Always test in a simulated environment before live trading. Not financial advice.
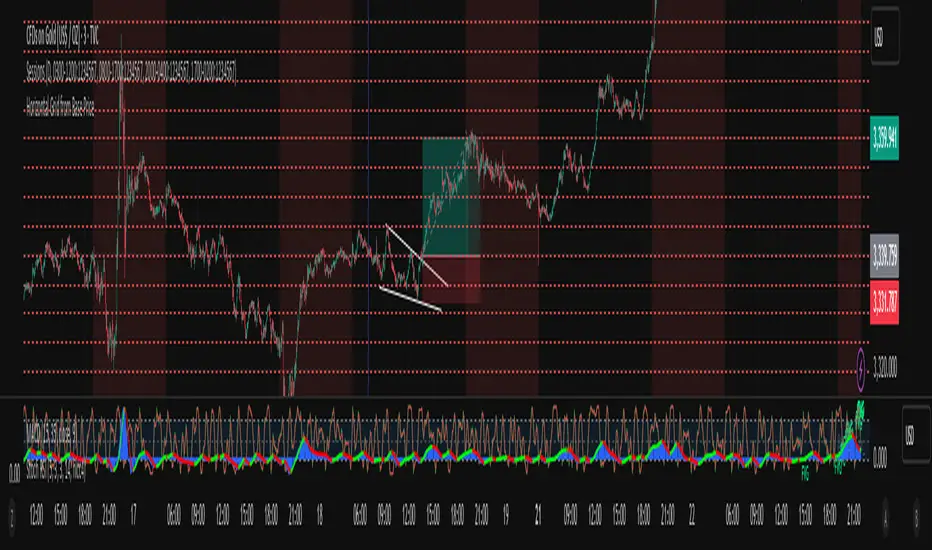
Horizontal Grid from Base PriceSupport & Resistance Indicator function
This inductor is designed to analyze the "resistance line" according to the principle of mother fish technique, with the main purpose of:
• Measure the price swing cycle (Price Swing Cycle)
• analyze the standings of a candle to catch the tempo of the trade
• Used as a decision sponsor in conjunction with Price Action and key zones.
⸻
🛠️ Main features
1. Create Automatic Resistance Boundary
• Based on the open price level of the Day (Initial Session Open) bar.
• It's the main reference point for building a price framework.
2. Set the distance around the resistance line.
• like 100 dots/200 dots/custom
• Provides systematic price tracking (Cycle).
3. Number of lines can be set.
• For example, show 3 lines or more of the top-bottom lines as needed.
4. Customize the color and style of the line.
• The line color can be changed, the line will be in dotted line format according to the user's style.
• Day/night support (Dark/Light Theme)
5. Support for use in conjunction with mother fish techniques.
• Use the line as a base to observe whether the "candle stand above or below the line".
• It is used to help see the behavior of "standing", "loosing", or "flow" of prices on the defensive/resistance line.
6. The default is available immediately.
• The default is based on the current Day bar opening price.
• Round distance, e.g. 200 points, top and bottom, with 3 levels of performance
Supply/Demand Zones - Fixed v3 (Cross YES Only)This Pine Script indicator creates Supply/Demand Zones with specific filtering criteria for TradingView. Here's a comprehensive description:
Supply/Demand Zones -(Cross YES Only)
Core Functionality
Session-Based Analysis: Identifies and visualizes price ranges during user-defined time sessions
Cross Validation Filter: Only displays zones when the "Cross" condition is met (Open and Close prices cross the mid-range level)
Real-Time Monitoring: Tracks price action during active sessions and creates zones after session completion
Key Features
Time Range Configuration
Customizable session hours (start/end time with minute precision)
Timezone support (default: Europe/Bucharest)
Flexible scheduling for different trading sessions
Visual Elements
Range Border: Dotted outline showing the full session range (High to Low)
Key Levels: Horizontal lines for High, Low, and Mid-range levels
Sub-Range Zones: Shaded areas showing Open and Close price zones
Percentage Labels: Display the percentage of range occupied by Open/Close zones
Active Session Background: Blue background highlighting during active sessions
Smart Filtering System
Cross Condition: Only creates zones when:
Open < Mid AND Close > Mid (bullish cross), OR
Open > Mid AND Close < Mid (bearish cross)
This filter ensures only significant price movements that cross the session's midpoint are highlighted
Customization Options
Display Controls: Toggle visibility for borders, lines, zones, and labels
Color Schemes: Full color customization for all elements
Transparency Settings: Adjustable transparency for zone fills
Text Styling: Configurable label colors and information display
Technical Specifications
Maximum capacity: 500 boxes, 500 lines, 200 labels
Overlay indicator (draws directly on price chart)
Bar-time based positioning for accurate historical placement
Use Cases
Supply/Demand Trading: Identify key price levels where institutions may have interest
Session Analysis: Understand price behavior during specific trading hours
Breakout Detection: Focus on sessions where price crosses significant levels
Support/Resistance: Use range levels for future trade planning
What Makes It Unique
The "Cross YES Only" filter ensures that only meaningful price sessions are highlighted - those where the market shows directional bias by crossing from one side of the range to the other, indicating potential institutional interest or significant market sentiment shifts.

THF Crossover and Trend Signals Golden & Death Cross with VolumeScript Overview:
This Pine Script is designed to assist traders in identifying key buy/sell signals and major trend changes on the chart using Exponential Moving Averages (EMA) and Simple Moving Averages (SMA), as well as visualizing Golden Cross and Death Cross events. The script also includes a volume indicator to highlight the volume trading activity in relation to the price movements.
Key Features:
1. Moving Averages:
EMA 21: Exponential Moving Average over a 21-period, shown in green.
EMA 50: Exponential Moving Average over a 50-period, shown in yellow.
SMA 50: Simple Moving Average over a 50-period, shown in red.
SMA 200: Simple Moving Average over a 200-period, shown in blue.
2. Signals:
Buy Signal: Generated when EMA 21 crosses above SMA 50, indicating a potential upward trend. Displayed with a green label below the price bar.
Sell Signal: Generated when EMA 21 crosses below SMA 50, indicating a potential downward trend. Displayed with a red label above the price bar.
3. Golden Cross (Bullish Trend):
A Golden Cross occurs when EMA 50 crosses above SMA 200, which often signals the start of a long-term upward trend. The signal is displayed with a yellow label below the price bar.
4. Death Cross (Bearish Trend):
A Death Cross occurs when EMA 50 crosses below SMA 200, which often signals the start of a long-term downward trend. The signal is displayed with a blue label above the price bar.
5. Volume Indicator:
The volume is plotted as colored columns. Green indicates higher volume than the 20-period moving average, and red indicates lower volume.
A Volume Moving Average (SMA 20) is also plotted to compare volume changes over time.
How the Script Works:
1. The EMA and SMA lines are plotted on the chart, providing a visual representation of the short- and long-term trends.
2. Buy/Sell signals are triggered based on the crossover between EMA 21 and SMA 50, helping to identify potential entry and exit points.
3. The Golden Cross and Death Cross indicators highlight major trend reversals based on the crossover between EMA 50 and SMA 200, providing clear visual cues for long-term trend changes.
4. Volume is displayed alongside price movements, offering insight into the strength or weakness of a trend.
Key Customizations:
Moving Average Periods: Users can modify the lengths of the EMAs and SMAs for customized analysis.
Volume Moving Average Period: The script allows for adjustment of the volume moving average period to suit different market conditions.
Signal Visibility: The size and color of the buy, sell, Golden Cross, and Death Cross signals can be easily customized to make them more prominent on the chart.
Conclusion:
This script is ideal for traders looking to combine price action with volume analysis, using key technical indicators such as EMA, SMA, Golden Cross, and Death Cross to make informed decisions in trending markets.
---
This explanation covers all aspects of the script and provides a clear understanding of its functionality, which is helpful for sharing the script or using it as an educational resource.

High Volume Buyers/Sellers+High Volume Buyers/Sellers+
This indicator helps traders spot bars where unusually high or extreme volume occurs, indicating strong buying or selling pressure.
How it works:
Calculates a volume moving average (SMA) over a user-defined period.
Marks bars where the current volume exceeds:
High Volume Multiplier → small green circle (bullish) or red circle (bearish).
Extreme Volume Multiplier → small green up-triangle (bullish) or red down-triangle (bearish).
Settings:
Volume MA Period → Number of bars used to calculate the average volume.
High Volume Multiplier → Threshold to define high volume.
Extreme Volume Multiplier → Threshold to define extreme volume.
Show Extreme Volume Signals → Option to enable or disable extreme volume markers.
Usage tips:
Apply this indicator on a clean chart to visually highlight momentum bursts or exhaustion points.
It works well for both intraday and swing trading strategies where volume confirmation matters.
⚠ Note: This script only displays on-chart markers and does not plot any lines or indicators.

Bollinger Bottom + Middle Lines with Inline TextThis script visualizes key Bollinger Band levels based on two different SMAs (20 & 50 periods), with clear labeling and a smart price table.
🔸 Features:
Draws lower and middle Bollinger Band lines for both SMA(20) and SMA(50)
Inline text at the end of each line instead of default labels (cleaner view)
A dynamic table in the top-right corner, sorted from highest to lowest level
Color-coded rows:
▪️ Orange → BB20 Mid & BB20 Lower
▪️ Green → BB50 Mid & BB50 Lower
Auto-updates each bar without cluttering the chart
✅ Ideal for identifying technical accumulation zones
✅ Suitable for investors using scaling-in strategies or mean-reversion logic

Turtle Trading System + ATR Trailing StopIndicator Description: Turtle ATR Trailing Stop
The **Turtle ATR Trailing Stop** is a technical indicator designed to enhance the classic Turtle Trading System by incorporating a dynamic trailing stop based on the Average True Range (ATR). This indicator is ideal for traders seeking to manage risk and lock in profits on both long and short positions in trending markets.
Key Features:
- Turtle Trading Levels: Calculates the 20-day highest high and lowest low to identify potential breakout points, a core principle of the Turtle Trading System.
- ATR-Based Trailing Stop: Utilizes a trailing stop that adjusts dynamically based on a multiple of the ATR (default multiplier: 2.0), providing a volatility-adjusted exit mechanism.
- Position Flexibility: Supports both long and short positions, with the trailing stop positioned below the highest price for long trades and above the lowest price for short trades.
- Smooth Updates: The trailing stop updates on each bar, ensuring a more responsive adjustment to price movements, rather than only on new highs or lows.
- Reset Mechanism: Automatically resets the trailing stop when the price deviates significantly (configurable threshold, default 0.1%), adapting to major trend reversals.
- Alerts: Includes customizable alerts that trigger when the price reaches the trailing stop level, notifying traders of potential exit points.
- Debugging Tools: Features an on-chart debug table displaying ATR, Close, Highest Price, Lowest Price, Potential Stop, and Trailing Stop values for real-time analysis.
How It Works:
- For **Long Positions**: The trailing stop starts below the initial close price (minus 2*ATR) and moves up as the highest price increases, locking in profits while trailing at a fixed ATR distance.
- For **Short Positions**: The trailing stop starts above the initial close price (plus 2*ATR) and moves down as the lowest price decreases, protecting against upward price movements.
- The stop resets if the price falls (for long) or rises (for short) beyond the set threshold, ensuring adaptability to new market conditions.
Customization:
- Period Settings: Adjust the length for highs/lows (default 20) and ATR period (default 14).
- ATR Multiplier: Modify the distance of the trailing stop (default 2.0).
- Reset Threshold: Fine-tune the percentage at which the stop resets (default 0.1%).
- Position Type: Switch between "Long" and "Short" modes via input settings.
Usage:
Apply this indicator to any chart in TradingView, set your preferred parameters, and monitor the trailing stop line (yellow) alongside the Turtle highs (red) and lows (blue). Use the debug table to validate calculations and set alerts to stay informed of stop triggers.
This indicator combines the trend-following strength of the Turtle System with a flexible, ATR-based stop-loss strategy, making it a powerful tool for both manual and automated trading strategies.

Intraday vs Overnight OBV🔍 Purpose
This indicator provides a volume-weighted cumulative flow model that mimics On-Balance Volume (OBV) logic but splits the volume impact into intraday vs. overnight sessions. It allows traders to track how volume contributes to price movement in each session and identify whether buying/selling pressure is stronger during or outside of regular trading hours.
This indicator attempts to alleviate some of the downfalls of the standard OBV indicator, which only looks at total volume and total direction. The price of stocks generally behaves extremely differently during market hours and outside market hours, and many of the large moves happen outside of regular market hours on low volume.
⚙️ Core Features
1) OBV-style calculation:
If price increases → volume is added to the OBV stream.
If price decreases → volume is subtracted.
If price is flat → OBV remains unchanged.
2) Session splitting:
Intraday session: movement from today's open to close.
Overnight session: movement from yesterday’s close to today’s open.
Volume is split proportionally between these two periods based on user input.
3) Four visualization modes:
"Intraday" — plots only OBV from intraday price movement.
"Overnight" — plots only OBV from overnight price movement.
"Aggregate" — plots the sum of intraday and overnight OBV for a holistic view.
"Both Intraday and Overnight" — plots intraday and overnight OBV separately on the same chart.
📐 Inputs
1) Synthetic OBV Type:
"Intraday" — Show OBV from open to close only.
"Overnight" — Show OBV from prior close to today's open only.
"Aggregate" — Show a single line combining both.
"Both Intraday and Overnight" — Show both lines on the same chart.
2) Estimated Overnight Volume %:
Percentage of total daily volume assumed to occur during extended hours.
The rest is allocated to regular session (intraday).
Default: 20% overnight, 80% intraday.
🧮 How It Works
Volume Splitting:
Total bar volume is split into overnight Volume and intraday Volume:
Intraday change is the difference between today’s close and open.
Overnight change is the difference between today’s open and yesterday’s close.
Session OBV Calculations:
OBV is incremented/decremented by the session's allocated volume, depending on whether the session’s price change was positive or negative.
Aggregate OBV:
Combines both session deltas for a holistic volume flow view.
📊 Interpretation
Rising OBV (any stream) suggests accumulation; falling OBV suggests distribution.
Divergences between price and OBV lines (especially overnight vs. intraday) can reveal where hidden buying/selling is occurring.
Comparing intraday vs overnight OBV can help:
Spot whether institutional demand is building off-hours.
Detect retail vs. institutional behavior (retail trades often dominate intraday; institutional may prefer after-hours).
💡 Use Cases
Identify whether overnight gaps are supported by overnight volume momentum.
Detect accumulation in low-volume overnight sessions.
Compare intraday and overnight strength during earnings season or news events.
Complement traditional OBV by seeing session-based breakdowns.

Crypto Breadth | AlphaNatt\ Crypto Breadth | AlphaNatt\
A dynamic, visually modern market breadth indicator designed to track the strength of the top 40 cryptocurrencies by measuring how many are trading above their respective 50-day moving averages. Built with precision, branding consistency, and UI enhancements for fast interpretation.
\ 📊 What This Script Does\
* Aggregates the performance of \ 40 major cryptocurrencies\ on Binance
* Calculates a \ breadth score (0.00–1.00)\ based on how many tokens are above their moving averages
* Smooths the breadth with optional averaging
* Displays the result as a \ dynamic, color-coded line\ with aesthetic glow and gradient fill
* Provides automatic \ background zones\ for extreme bullish/bearish conditions
* Includes \ alerts\ for key threshold crossovers
* Highlights current values in an \ information panel\
\ 🧠 How It Works\
* Pulls real-time `close` prices for 40 coins (e.g., XRP, BNB, SOL, DOGE, PEPE, RENDER, etc.)
* Compares each coin's price to its 50-day SMA (adjustable)
* Assigns a binary score:
• 1 if the coin is above its MA
• 0 if it’s below
* Aggregates all results and divides by 40 to produce a normalized \ breadth percentage\
\ 🎨 Visual Design Features\
* Smooth blue-to-pink \ color gradient\ matching the AlphaNatt brand
* Soft \ glow effects\ on the main line for enhanced legibility
* Beautiful \ multi-stop fill gradient\ with 16 transition zones
* Optional \ background shading\ when extreme sentiment is detected:
• Bullish zone if breadth > 80%
• Bearish zone if breadth < 20%
\ ⚙️ User Inputs\
* \ Moving Average Length\ – Number of periods to calculate each coin’s SMA
* \ Smoothing Length\ – Smooths the final breadth value
* \ Show Background Zones\ – Toggle extreme sentiment overlays
* \ Show Gradient Fill\ – Toggle the modern multicolor area fill
\ 🛠️ Utility Table (Top Right)\
* Displays live breadth percentage
* Shows how many coins (e.g., 27/40) are currently above their MA
\ 🔔 Alerts Included\
* \ Breadth crosses above 50%\ → Bullish signal
* \ Breadth crosses below 50%\ → Bearish signal
* \ Breadth > 80%\ → Strong bullish trend
* \ Breadth < 20%\ → Strong bearish trend
\ 📈 Best Used For\
* Gauging overall market strength or weakness
* Timing trend transitions in the crypto market
* Confirming trend-based strategies with broad market support
* Visual dashboard in macro dashboards or strategy overlays
\ ✅ Designed For\
* Swing traders
* Quantitative investors
* Market structure analysts
* Anyone seeking a macro view of crypto performance
Note: Not financial advise

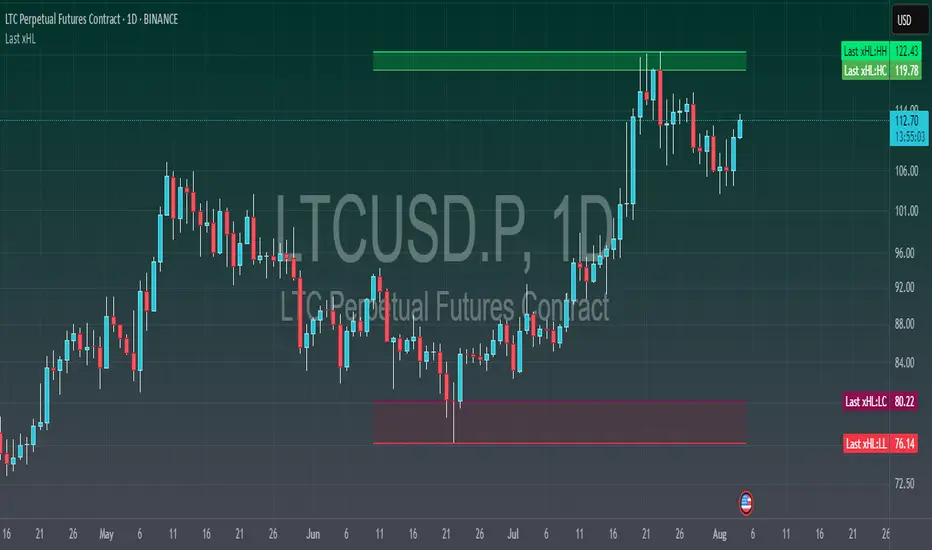
Last xHL📈 Last xHL – Visualize Key Highs and Lows
This script highlights the most recent significant highs and lows over a user-defined period, helping traders quickly identify key support and resistance zones.
🔍 Features:
Highest High (HH) and Highest Close/Open (HC) lines
Lowest Low (LL) and Lowest Close/Open (LC) lines
Dynamic updates with each new bar
Gradient-filled zones between HH–HC and LL–LC for visual clarity
⚙️ Customization:
Adjustable lookback period (_length) to suit your trading style
Color-coded lines and fills for quick interpretation
🧠 Use Case:
This tool is ideal for traders who want to:
Spot potential breakout or reversal zones
Identify price compression or expansion areas
Enhance their technical analysis with visual cues
This script is for educational and informational purposes only. It does not constitute financial advice. Always do your own research before making trading decisions.
Candle Emotion Oscillator [CEO]Candle Emotion Oscillator (CEO) - Revolutionary User Guide
🧠 World's First Market Psychology Oscillator
The Candle Emotion Oscillator (CEO) is a groundbreaking indicator that measures market emotions through pure candle price action analysis. This is the first oscillator ever created that translates candle patterns into psychological states, giving you unprecedented insight into market sentiment.
🚀 Revolutionary Concept
What Makes CEO Unique
100% Pure Price Action: No volume, no external data - just candle analysis
Market Psychology: Measures actual emotions: Fear, Greed, Panic, Euphoria
Never Been Done Before: First oscillator to analyze market emotions
Exhaustion Prediction: Detects emotional fatigue before reversals
Fast Response: Perfect for your 2-5 minute scalping setup
The Four Core Emotions
🟢 GREED (Positive Values)
What it measures: Market conviction and decisiveness
Candle Pattern: Large bodies, small wicks
Psychology: Traders are confident and decisive
Oscillator: Positive values (0 to +100)
Trading Implication: Trend continuation likely
🔴 FEAR (Negative Values)
What it measures: Market uncertainty and indecision
Candle Pattern: Small bodies, large wicks
Psychology: Traders are uncertain and hesitant
Oscillator: Negative values (0 to -100)
Trading Implication: Consolidation or reversal likely
🚀 EUPHORIA (Extreme Positive)
What it measures: Excessive optimism and buying pressure
Candle Pattern: Large green bodies with upper wicks
Psychology: Extreme bullish sentiment
Oscillator: Values above +60
Trading Implication: Overbought, reversal warning
💥 PANIC (Extreme Negative)
What it measures: Capitulation and selling pressure
Candle Pattern: Large red bodies with lower wicks
Psychology: Extreme bearish sentiment
Oscillator: Values below -60
Trading Implication: Oversold, reversal opportunity
📊 Visual Elements Explained
Main Components
Thick Colored Line: Primary emotion oscillator
Green: Greed (positive emotions)
Red: Fear (negative emotions)
Bright Green: Euphoria (extreme positive)
Dark Red: Panic (extreme negative)
Thin Blue Line: Emotion trend (longer-term context)
Background Gradient: Emotional intensity
Darker = stronger emotions
Lighter = weaker emotions
Diamond Signals: 🔶 Emotional exhaustion detected
Rocket Signals: 🚀 Extreme euphoria warning
Explosion Signals: 💥 Extreme panic warning
Information Table (Top Right)

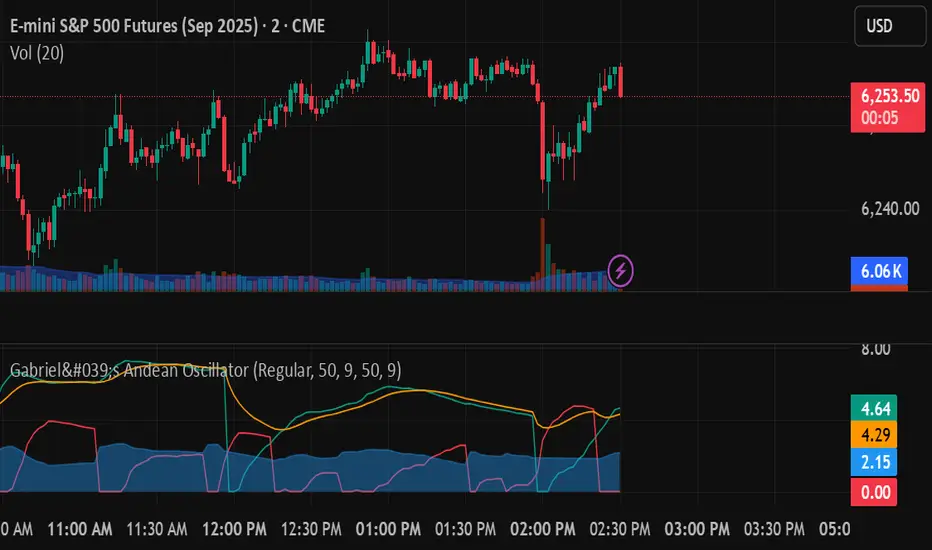
Gabriel's Andean Oscillator📈 Gabriel's Andean Oscillator — Enhanced Trend-Momentum Hybrid
Gabriel's Andean Oscillator is a sophisticated trend-momentum indicator inspired by Alex Grover’s original Andean Oscillator concept. This enhanced version integrates multiple envelope types, smoothing options, and the ability to track volatility from both open/close and high/low dynamics—making it more responsive, adaptable, and visually intuitive.
🔍 What It Does
This oscillator measures bullish and bearish "energy" by calculating variance envelopes around price. Instead of traditional momentum formulas, it builds two exponential variance envelopes—one capturing the downside (bullish potential) and the other capturing the upside (bearish pressure). The result is a smoothed oscillator that reflects internal market tension and potential breakouts.
⚙️ Key Features
📐 Envelope Types:
Choose between:
"Regular" – Uses single EMA-based smoothing on open/close variance. Ideal for shorter timeframes.
"Double Smoothed" – Adds an extra layer of smoothing for noise reduction. Ideal for longer timeframes.
📊 Bullish & Bearish Components:
Bull = Measures potential upside using price lows (or open/close).
Bear = Measures downside pressure using highs (or open/close).
These can optionally be derived from high/low or open/close for flexible interpretation.
📏 Signal Line:
A customizable EMA of the dominant component to confirm momentum direction.
📉 Break Zone Area Plot:
An optional filled area showing when bull > bear or vice versa, useful for detecting expansion/contraction phases.
🟢 High/Low Overlay Option (Use Highs and Lows?):
Visualize secondary components derived from high/low prices to compare against the open/close dynamics and highlight volatility asymmetry.
🧠 How to Use It
Trend Confirmation:
When bull > bear and rising above signal → bullish bias.
When bear > bull and rising above signal → bearish bias.
Breakout Potential:
Watch the Break area plot (√(bull - bear)) for rapid expansion, signaling volatility bursts or directional moves.
High/Low Envelope Divergence:
Enabling the high/low comparison reveals hidden strength or weakness not visible in open/close alone.
🛠 Customizable Inputs
Envelope Type: Regular vs. Double Smoothed
EMA Envelope Lengths: For both regular and smoothed logic
Signal Length: Controls EMA smoothing for the signal
Use Highs and Lows?: Toggles second set of envelopes; the original doesn't include highs and lows.
Plot Breaks: Enables the filled “break” zone area, the squared difference between Open and Close.
🧪 Based On:
Andean Oscillator - Alpaca Markets
Licensed under CC BY-NC-SA 4.0
Developed by Gabriel, based on the work of Alex Grover
BK AK-SILENCER (P8N)🚨Introducing BK AK-SILENCER (P8N) — Institutional Order Flow Tracking for Silent Precision🚨
After months of meticulous tuning and refinement, I'm proud to unleash the next weapon in my trading arsenal—BK AK-SILENCER (P8N).
🔥 Why "AK-SILENCER"? The True Meaning
Institutions don’t announce their moves—they move silently, hidden beneath the noise. The SILENCER is built specifically to detect and track these stealth institutional maneuvers, giving you the power to hunt quietly, execute decisively, and strike precisely before the market catches on.
🔹 "AK" continues the legacy, honoring my mentor, A.K., whose teachings on discipline, precision, and clarity form the cornerstone of my trading.
🔹 "SILENCER" symbolizes the stealth aspect of institutional trading—quiet but deadly moves. This indicator equips you to silently track, expose, and capitalize on their hidden footprints.
🧠 What Exactly is BK AK-SILENCER (P8N)?
It's a next-generation Cumulative Volume Delta (CVD) tool crafted specifically for traders who hunt institutional order flow, combining adaptive volatility bands, enhanced momentum gradients, and precise divergence detection into a single deadly-accurate weapon.
Built for silent execution—tracking moves quietly and trading with lethal precision.
⚙️ Core Weapon Systems
✅ Institutional CVD Engine
→ Dynamically measures hidden volume shifts (buying/selling pressure) to reveal institutional footprints that price alone won't show.
✅ Adaptive AK-9 Bollinger Bands
→ Bollinger Bands placed around a custom CVD signal line, pinpointing exactly when institutional accumulation or distribution reaches critical extremes.
✅ Gradient Momentum Intelligence
→ Color-coded momentum gradients reveal the strength, speed, and silent intent behind institutional order flow:
🟢 Strong Bullish (aggressive buying)
🟡 Moderate Bullish (steady accumulation)
🔵 Neutral (balance)
🟠 Moderate Bearish (quiet distribution)
🔴 Strong Bearish (aggressive selling)
✅ Silent Divergence Detection
→ Instantly spots divergence between price and hidden volume—your earliest indication that institutions are stealthily reversing direction.
✅ Background Flash Alerts
→ Visually highlights institutional extremes through subtle background flashes, alerting you quietly yet powerfully when market-moving players make their silent moves.
✅ Structural & Institutional Clarity
→ Optional structural pivots, standard deviation bands, volume profile anchors, and session lines clearly identify the exact levels institutions defend or attack silently.
🛡️ Why BK AK-SILENCER (P8N) is Your Edge
🔹 Tracks Institutional Footprints—Silently identifies hidden volume signals of institutional intentions before they’re obvious.
🔹 Precision Execution—Cuts through noise, allowing you to execute silently, confidently, and precisely.
🔹 Perfect for Traders Using:
Elliott Wave
Gann Methods (Angles, Squares)
Fibonacci Time & Price
Harmonic Patterns
Market Profile & Order Flow Analysis
🎯 How to Use BK AK-SILENCER (P8N)
🔸 Institutional Reversal Hunting (Stealth Mode)
Bearish divergence + CVD breaking below lower BB → stealth short signal.
Bullish divergence + CVD breaking above upper BB → quiet, early long entry.
🔸 Momentum Confirmation (Silent Strength)
Strong bullish gradient + CVD above upper BB → follow institutional buying quietly.
Strong bearish gradient + CVD below lower BB → confidently short institutional selling.
🔸 Noise Filtering (Patience & Precision)
Neutral gradient (blue) → remain quiet, wait patiently to strike precisely when institutional activity resumes.
🔸 Structural Precision (Institutional Levels)
Optional StdDev, POC, Value Areas, Session Anchors clearly identify exact institutional defense/offense zones.
🙏 Final Thoughts
Institutions move in silence, leaving subtle footprints. BK AK-SILENCER (P8N) is your specialized weapon for tracking and hunting their quiet, decisive actions before the market reacts.
🔹 Dedicated in deep gratitude to my mentor, A.K.—whose silent wisdom shapes every line of code.
🔹 Engineered for the disciplined, quiet hunter who knows when to wait patiently and when to strike decisively.
Above all, honor and gratitude to Gd—the ultimate source of wisdom, clarity, and disciplined execution. Without Him, markets are chaos. With Him, we move silently, purposefully, and precisely.
⚡ Stay Quiet. Stay Precise. Hunt Silently.
🔥 BK AK-SILENCER (P8N) — Track the Silent Moves. Strike with Precision. 🔥
May Gd bless every silent step you take. 🙏

GeeksDoByte 15m & 30m ORB + Prev Day High/LowCME_MINI:NQ1!
How It Works
Opening Ranges
At 9:30 ET, the script begins tracking the high & low.
It uses two fixed sessions:
15 min from 09:30 to 09:45
30 min from 09:30 to 10:00
On the very first bar of each session it initializes the range, then continuously updates the high/low on each new intraday bar.
Dashed lines are drawn when the session opens and extended horizontally across subsequent bars.
Previous Day’s Levels
Independently, it fetches yesterday’s high and low via a daily security call.
These historic levels are plotted as simple horizontal lines for daily context.
How to Use
Breakout Entries
A close above the 15 min ORB high can signal an early breakout; a further push above the 30 min ORB high confirms extended momentum.
Conversely, breaks below the respective lows can indicate short setups.
Support & Resistance
Yesterday’s high/low often act as magnet levels. If price is near the previous high when the opening ranges break, you get a confluence zone worth watching.
Trade Management
Combine the two opening-range levels to tier your stops or scale in.
For example, you might place an initial stop below the 15 min low and a wider stop below the 30 min low.

Mongoose Conflict Risk Radar v1.1 (Separate Panel) description
The Mongoose Capital: Risk Rotation Index is a macro market sentiment tool designed to detect elevated risk conditions by aggregating signals across key asset classes.
This script evaluates trend strength across 8 ETFs representing major risk-on and risk-off flows:
GLD – Gold
VIXY – Volatility
TLT – Long-Term Bonds
SPY – S&P 500
UUP – U.S. Dollar Index
EEM – Emerging Markets
SLV – Silver
FXI – China Large-Cap
Each asset is assigned a binary signal based on price position vs. its 21-period SMA (or a crossover for bonds). The signals are then totaled into a composite Risk Rotation Score, plotted as a bar graph.
How to Use
0–2 = Low risk-on behavior
3–4 = Caution / Mixed regime
5–8 = Elevated conflict or macro stress
Use this as a macro confirmation layer for trend entries, risk reduction, or allocation shifts.
Alerts
Set alerts when the index exceeds 5 to track major rotations into defensive assets.

CVD Strength | VTS Pro🔷 CVD Strength | VTS Pro
By Alireza Mossaheb
Description:
CVD Strength is a powerful tool designed to analyze market momentum by visualizing the Cumulative Volume Delta (CVD) using advanced techniques. This indicator provides a multi-timeframe view of volume delta behavior and highlights strong and weak bullish/bearish conditions based on volume spikes, candle size, and optional moving average filters.
Key Features:
Multi-timeframe CVD candle plotting with color-coded strength signals
Optional EMA (21), WMA (30), and SMA (50) overlays for trend filtering
Smart strength detection logic using volume, candle size, and moving average crossovers
Bullish and bearish crossover signals marked on chart
Customizable anchor and lower timeframes for flexible analysis
Alerts users when data vendor does not supply volume information
This script is particularly useful for identifying institutional buying/selling pressure and can be used effectively in both trend-following and mean-reversion strategies.

BTC Transaction Indicator Name: "Bitcoin On-Chain Volume & Dynamic Parabolic Curve Signals"
Purpose:
This indicator is designed for Bitcoin traders and long-term holders. It combines the analysis of Bitcoin's on-chain transaction volume with price action to generate "Whale" and "Bear" signals. Additionally, it features a unique dynamic parabolic curve that acts as a visual support line, adapting its visibility based on price interaction with a key Exponential Moving Average (EMA).
Key Components:
On-Chain Volume Analysis:
Utilizes Estimated Transaction Volume (ETRAV) data from the Bitcoin blockchain.
Calculates fast and slow Simple Moving Averages (SMAs) of this volume.
Identifies volume trends (up/down) and significant volume increases/decreases.
Employs fixed thresholds (2,500,000 for low volume and 25,000,000 for high volume) to define key activity levels, similar to how historical on-chain analysis defined accumulation and distribution zones.
Price Action Analysis:
Calculates fast and slow SMAs of the price.
Detects price trends (up/down), recoveries, and declines based on these price SMAs.
"Whale" and "Bear" Signals:
Whale Signals (Buy-side): Generated when there's an upward volume trend, significant volume increase, and a downward price trend followed by price recovery. These indicate potential accumulation phases.
Bear Signals (Sell-side): Generated when there's a downward volume trend, significant volume decrease, and an upward price trend followed by price decline. These indicate potential distribution phases.
Visuals: Both types of signals are plotted as small, colored circles directly on the price chart, with corresponding text labels ("Whale," "Buy," "Bear," "Sell," "Price Recovering," "Price Declining").
Dynamic Parabolic Curve:
Concept: A green parabolic (exponential) curve that serves as a dynamic visual support line.
Activation: The curve starts drawing automatically only when the price crosses over the EMA 500 (Exponential Moving Average of 500 periods). The curve's starting point is set at a user-defined percentage below the EMA 500 value at that exact crossover point.
Visibility: The curve remains visible and continues its trajectory only as long as the price stays above the EMA 500.
Deactivation: The curve disappears instantly if the price falls below or equals the EMA 500. It will only reappear if the price crosses above the EMA 500 again.
Customization: The curve's steepness (Tasa Crecimiento Curva) and its initial distance from the EMA 500 (Inicio Curva % por debajo de EMA500) are adjustable.
Dynamic Label: A "Parabólico" text label is plotted near the center of the active curve segment, with an adjustable vertical offset to ensure it stays visually appealing below the curve.
What is PLOTTED on the chart:
The small, colored circle signals for Whale/Buy and Bear/Sell activity.
The green dynamic parabolic curve.
What is NOT PLOTTED:
EMA 200, EMA 500 lines (though they are calculated internally for logic).
Raw volume data or volume Moving Averages (these are only used for signal calculation, not plotted).
Ideal for:
Bitcoin traders and investors focused on long-term trends and cycle analysis, who want visual cues for accumulation/distribution phases based on on-chain activity, complemented by a unique, dynamically appearing parabolic support curve.
Important Notes:
Relies on the availability of external on-chain data (QUANDL:BCHAIN) within TradingView.
Functions best on a daily timeframe for optimal on-chain data relevance.

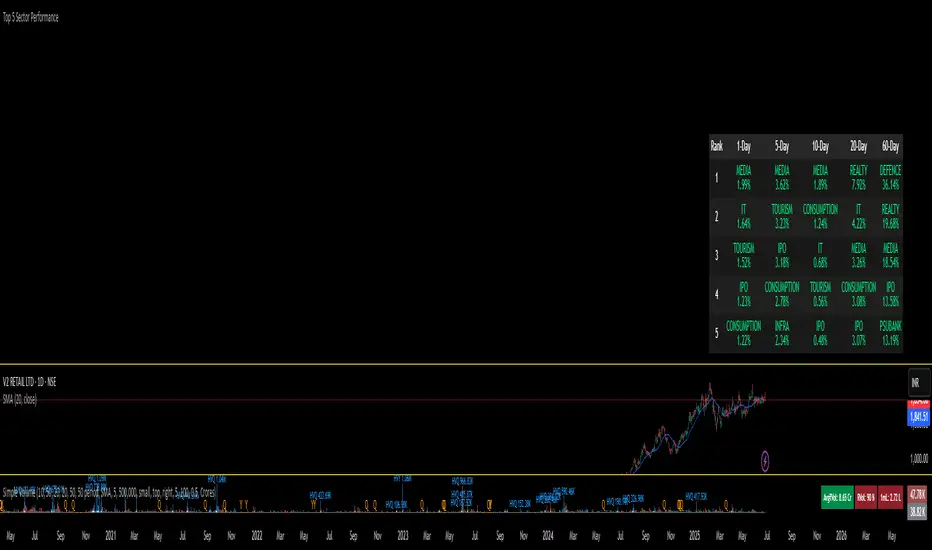
Super PerformanceThe "Super Performance" script is a custom indicator written in Pine Script (version 6) for use on the TradingView platform. Its main purpose is to visually compare the performance of a selected stock or index against a benchmark index (default: NIFTYMIDSML400) over various timeframes, and to display sector-wise performance rankings in a clear, tabular format.
Key Features:
Customizable Display:
Users can toggle between dark and light color themes, enable or disable extended data columns, and choose between a compact "Mini Mode" or a full-featured table view. Table positions and sizes are also configurable for both stock and sector tables.
Performance Calculation:
The script calculates percentage price changes for the selected stock and the benchmark index over multiple periods: 1, 5, 10, 20, 50, and 200 days. It then checks if the stock is outperforming the index for each period.
Conviction Score:
For each period where the stock outperforms the index, a "conviction score" is incremented. This score is mapped to qualitative labels such as "Super solid," "Solid," "Good," etc., and is color-coded for quick visual interpretation.
Sector Performance Table:
The script tracks 19 sector indices (e.g., REALTY, IT, PHARMA, AUTO, ENERGY) and calculates their performance over 1, 5, 10, 20, and 60-day periods. It then ranks the top 5 performing sectors for each timeframe and displays them in a sector performance table.
Visual Output:
Two tables are constructed:
Stock Performance Table: Shows the stock's returns, index returns, outperformance markers (✔/✖), and the difference for each period, along with the overall conviction score.
Sector Performance Table: Ranks and displays the top 5 sectors for each timeframe, with color-coded performance values for easy comparison.

Top 5 Sector Performancehe indicator creates a table showing:
Top 5 performing sectors for 3 timeframes: 1-day, 10-day, and 20-day periods
Performance data including sector name and percentage change
Color-coded results: Green (positive), Red (negative), Gray ("N/A" for missing data)
Key Features
Table Structure:
Columns: Rank | 1-Day | 10-Day | 20-Day
Rows: Top 5 sectors for each timeframe
Header: Dark gray background with white text
Rows: Alternating dark gray shades for readability
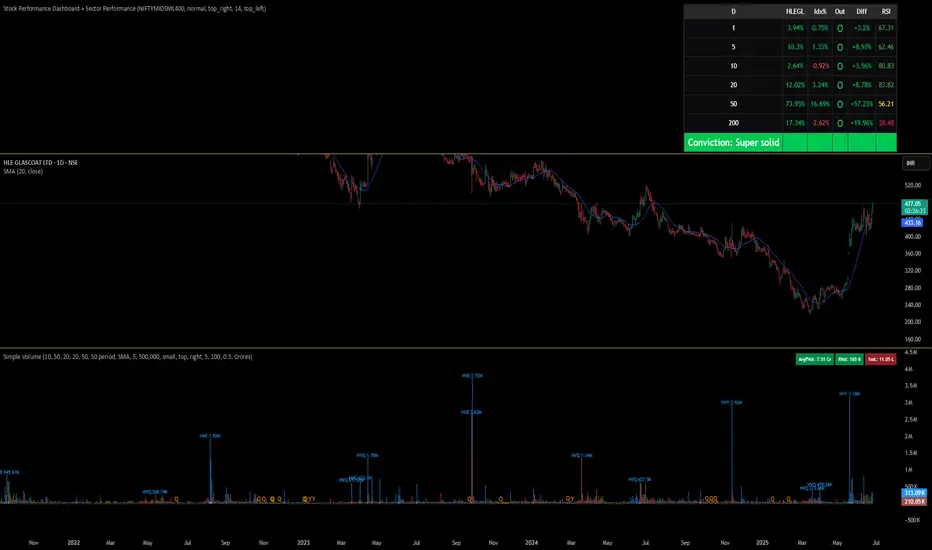
Stock Performance Dashboard + Sector PerformanceThis indicator, Stock Performance Dashboard + Sector Performance, provides a comprehensive visual analysis of both individual stock performance and sectoral trends directly on your TradingView chart.
Key Features:
Performance Dashboard Table:
Displays the stock’s returns over multiple timeframes (1, 5, 10, 20, 50, 200 days) and compares them to a selected benchmark index (default: NIFTYMIDSML400).
Highlights whether the stock is outperforming the index for each period, shows the difference in performance, and includes an RSI (Relative Strength Index) column for additional momentum insight.
Calculates and displays a “conviction” score and level based on how often the stock outperforms the index across periods.
Sector Performance Table:
Ranks and displays the top-performing sectors from a predefined list of major NSE sector indices over four key periods (1D, 5D, 30D, 50D).
For each period, the top 5 sectors are shown, with color-coded performance for quick visual assessment.
Customization:
Includes options for dark/light mode, table size, position, and which columns to display.
Supports a compact “mini mode” for simplified visualization.
Usage:
This tool is ideal for traders and investors who want a quick, at-a-glance comparison of a stock’s short- and long-term momentum versus its benchmark, as well as a live snapshot of sector rotation and leadership in the Indian market. All data is presented in clear, color-coded tables for actionable decision-making.
Stock Performance DashboardStock Performance Dashboard
This indicator provides a compact, color-coded table comparing the performance of the current stock to a benchmark index across multiple timeframes: 1, 5, 10, 20, 50, and 200 days.
Columns: Period, Stock %, Index %, Outperforming (✔/✖), and Difference.
Conviction Score: The last row summarizes overall outperformance as a “conviction” level (e.g., Super solid, Solid, Good, Ok, Needs improv., Poor).
Mini Mode: For a quick view, Mini Mode shows only the period and outperformance status.
Customizable: Supports dark/light mode, table size, position, and optional difference column.
Space Efficient: Short headers and a minimized layout make it easy to add more info or columns in future versions.
How to use:
Add the indicator to any chart. Adjust settings in the indicator panel to change the benchmark index, enable mini mode, or reposition the table.
Ideal for:
Traders who want a fast, at-a-glance summary of how a stock is performing against its benchmark across key timeframes, directly on the chart.

Liquidity Zones (JTS)Title: Liquidity Zones (JTS)
Description:
This script marks out key liquidity zones using pivot highs and lows. It includes:
Buy-Side Liquidity (Highs): Shown in red lines
Sell-Side Liquidity (Lows): Shown in green lines
Sweep Protection: Zones will only be removed after a defined number of bars AND a true sweep beyond the level
Toggle Controls: Enable/disable highs or lows individually
Adjustable Settings: Pivot length, sweep delay, max lines, and colors
Perfect for traders looking to track untapped or recently swept liquidity.
Created by JTS
For educational and strategic use
