Range Detector [LuxAlgo]The Range Detector indicator aims to detect and highlight intervals where prices are ranging. The extremities of the ranges are highlighted in real-time, with breakouts being indicated by the color changes of the extremities.
🔶 USAGE
Ranging prices are defined by a period of stationarity, that is where prices move within a specific range.
Detecting ranging markets is a common task performed manually by traders. Price breaking one of the extremities of a range can be indicative of a new trend, with an uptrend if price breaks the upper range extremity, and a downtrend if price breaks the lower range extremity.
Ranges are highlighted as zones and are set retrospectively, that is the starting point of a range is offset in the past. The exact moment a range is detected is highlighted by a gray background color. The average between the maximum/minimum of a zone is also highlighted as a dotted line and is also set retrospectively.
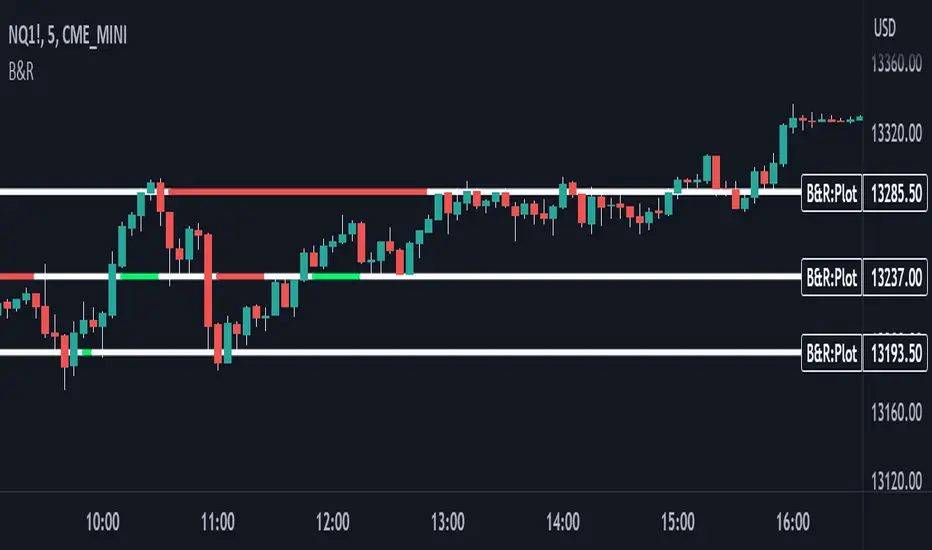
The range extremities are set in real-time, blue extremities indicate the range extremities were not broken, green extremities indicate that price broke the upper range extremity, while red extremities indicate price broke the lower range extremity.
Extremities are extended until a new range is detected, allowing past ranges extremities can be used as future support/resistances.
🔶 DETAILS
The detection algorithm used to detect ranges tests if all the prices within a user-set window are all within two extremities. These extremities are determined by the mean of the detection window plus/minus an ATR value.
When a new range is detected, the script checks if this new range overlaps with a previously detected range, if this is the case, both ranges are merged into one; updating the extremities of the previous range.
This can be observed with the real-time extremities changing within a highlighted zone.
🔶 SETTINGS
Minimum Range Length: Minimum amount of bars needed to detect a range.
Range Width: Multiplicative factor for the ATR used to detect new ranges. Lower values detect ranges with a lower width. Using higher values might return false positives.
ATR Length: ATR length used to determine the range width.
مؤشر Pine Script®