All Candlestick Patterns - ExportThis is a copy of the built-in All Candlestick Patterns indicator, but with an additional plot for each indicator to support exporting. When exporting, each candlestick pattern will have its own column, with a 1 indicating the candlestick pattern was detected, and 0 indicating it wasn't. The plots are all overlaid, so are they are not useful for viewing, they are only used to generate values to export. This indicator also does not include alerts, so the built-in indicator should be used for everything except exporting.
تحليل الشموع اليابانية

Point and Figure Chart - LiveHello Traders,
This is "Point and Figure Chart (PnF)" script that run in separated window in real time. The separated PnF chart window is timeless, so no relation with the time on the chart. PnF chart consist of "X" and "O" columns. While "X" columns represents rising prices, "O" column represents a falling price. If you have no idea about what PnF charting is then you should search for "Point and Figure Charting" on the net and get some info before using this script.
Now lets talk about details. PnF Chart requires at least two variables to be set => Box size and Reversal. Box size represents the size of each X/O in PnF chart and the reversal is used to calculate new X/O or reversal. for example if currrent column is X column then for new "X", "box size * 1" move is needed and for new "O" column or reversal, "box size * revelsal" move is needed. in the script I use lines as X/O columns.
In the options you can set "Box Size Assingment Method". you have 3 options Traditional, ATR, Percentage . what are they?
Traditional: user-defined box size, means you can set the box size as you wish, using the option . if you use this option then you should set it accordingly.
ATR : that's dynamic box size scaling and on each columns it's calculated once, you can set length for ATR
Percentage: that's also dynamic box size scaling according to closing price when new column appeared. if you use this option then you should set it accordingly.
Reversal: The reversal is typically 3 but you can change it as you wish
"Change Bar Color by PnF Trend": if you enable this option then bar color changes by PnF columns, by default it's not enabled
"Change Column Color When Breakout Occurs": PnF color changes if Double Top/Bottom breakout accours. enabled by default and you can set the colors as you wish using the options
"Change Bar Color When Breakout Occurs": bar colors changed if Double Top/Bottom breakout accours. enabled by default and you can set the colors as you wish using the options
the script checks only Double Top/Bottom breakouts at the moment. there are many other breakouts such Triple/Quadruple, Ascending/Descending Triple Top/Bottom breakouts, Catapult etc.
Also the script shows new X/O level and reversal Levels in PnF window. An example:
If you enable "Change Bar Color by PnF Trend" option:
An example if you disable the option "Change Column Color When Breakout Occurs
You may want to see my another/older "Point and Point Chart" script as well. you can find it in my profile/published scripts and in the Public Library. I use same PnF calculation algorithm in both scripts.
Enjoy!

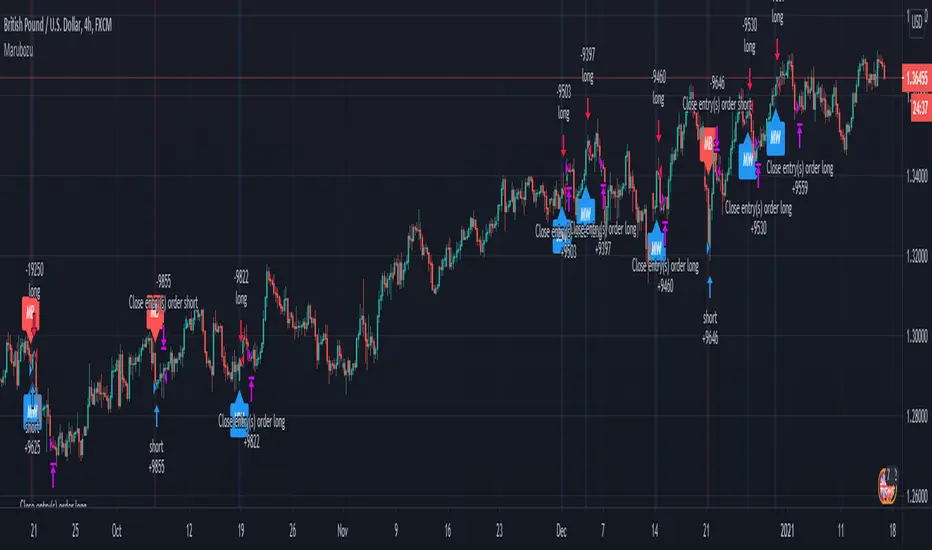
Marubozu Forex Price actionHi, today I bring you a price action strategy/indicator for Forex, made out for Marubozu candle type.
For the entries of it check if we have a long or a short marubozu.
For exit we have for long when the actual candle is green and the last previous two were red.
For exit we have for short, when the actual candle is red and the last previous two were green.
If you have any questions private message me !
Tweezers and Kangaroo TailHello Traders,
Here Tweezers and Kangaroo Tail script is in your service. The script searches for Tweezer / Kangaroo Tail candlestick patterns and shows them as T (Tweezer) and K (Kangaroo Tail). Thanks to RorschachT who game me the idea and some details while working on this script.
What are these candlestick patterns?
Tweezers :
- A tweezers pattern occurs when the highs/Lows of two candlesticks occur at almost exactly the same level
- Both candles must have wicks
- Bigger Wick / Smaller Wick rate should not be greater than 150% ( 150% by default and you have option to change it)
- First Candle must be highest/lowest for last 5 candles (5 by default and you have option to change it)
- The level of High for Top, Low for Bottom must be almost lower than 20% of the bigger wick of tweezer candles (20% by default and you have option to change it)
- The Candles can be right next to each other or apart but not more than 12 candles apart (12 by default and you have option to change it)
- You will see that Tweezers pattern occurs frequently
Kangaroo Tail:
- Looks almost like a Hammer or Inverted Hammer candle
- They have both its open and close in the top or bottom third of the candle
- There must be some space/room on the left of the kangaroo tail
- The open and close of the Kangaroo Tail candle must be inside the range of the previous candlestick
- The next candle should create a new high or new low
- You have several options to set details about the "Room" that should be on the left and also options for Wick/Body rates
- You can see example below
You have option to enable/disable any of these patterns.
as far as I have tested they are strong reversal patterns but none of the indicators or patterns may not be enough alone. so you should confirm the signals using other indicators or tools
If you need more information you can find a lot of info on the net ;)
Example: Tweezers - Aparted
Example: Kangaroo Tail - Bullish
Enjoy!

High timeframe Highs, Lows, Opens, Closes. HTF Candles displayPosting previously requested indicator.
Overlays higher timeframe high and low over the current bars - pictured is daily high and low overlayed on lower timeframe chart.
Can be set to fill between the open and close to show higher timeframe candles by color, with bullish or bearish fills
Very versatile and can be used to display weekly or monthly opens, or used to display previous weekly highs and lows for charting out possible liquidity points, etc.
Originally converted from Chris Moody's HLOC pine version 2 indicator.

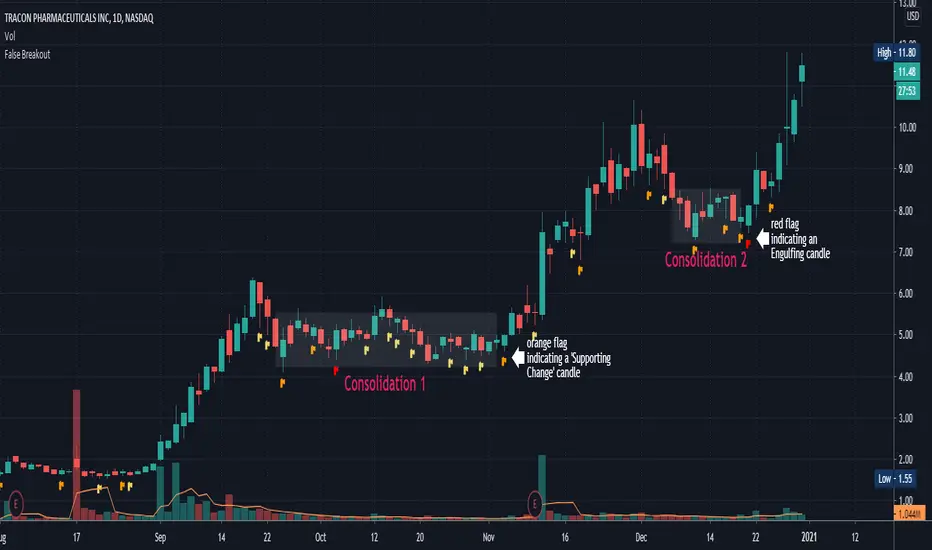
False BreakoutA false breakout is when the price temporarily moves above or below a key support or resistance level, but then later retreats back to the same side as it started.
The “False Breakout” indicator reveals false breakouts in comparison to the previous candle.
In case we're looking to trade the stock for long this would mean that the price of the stock broke the previous low (support) and then got back above that low.
In case we're looking to trade the stock for short then a false breakout would mean the stock broke the previous high (resistance) and then got back below that high.
How to use the indicator?
First choose the direction you're looking to trade, meaning either long or short.
Then choose how strict you want to be about the Falls brakes.
There are three options:
The first option named “All“ means that it's enough that the stock broke the previous level and then get back to the original side.
The second option is “Supporting Change” meaning not only that the stock broke the previous key level (support or resistance), but also the change at the end of the candle is supporting the main direction - meaning the change is positive for long or negative for short.
The third option is “Engulfing”. This is a well-known candle, but to make it clear, in our case “Engulfing” means that not only the stock broke the previous level but it also ended the day on the other side of the candle - higher than the previous high, in case of long, and lower than the previous low, in case of short.
When you choose the level of strictness you determine how many indications you're going to get on the chart.
If you choose the highest level of strictness, meaning “Engulfing”, you would only see the red flags indicating engulfing candles.
If you choose the lowest level of strictness, meaning “All”, you will get more indications on your chart, including every false breakout.
When the direction you're looking for is long, all indications would appear below the candles.
When the direction you're looking for is short, then all indications would appear above the candles.
The Engulfing candles are represented by Red flags, and the Simple breakouts candles are represented by yellow. All colors may be adjusted to your preference.
Explaining the example above:
In the chart above we can see two consolidations. At the end of each consolidation, we can see a candle with an indication from the indicator that points out that this could be the end of the consolidation and the stock might continue its move.
In “consolidation 1” we can see that there is an orange flag below the candle right before the stock began to move up again.
In “consolidation 2” we can see that there is a red flag below the candle, right before the stock began another move.
Wishing you all the best :)
Hammer & Shooting Star Candle DetectorHi guys
This script will help you to find Hammer candles and also Shooting star candles.
These candle patterns indicate price reversal probability and should evaluate in bigger price context before using as a signal.
I hope you find it helpful and enjoy it.
Please leave your comments for improving this script.

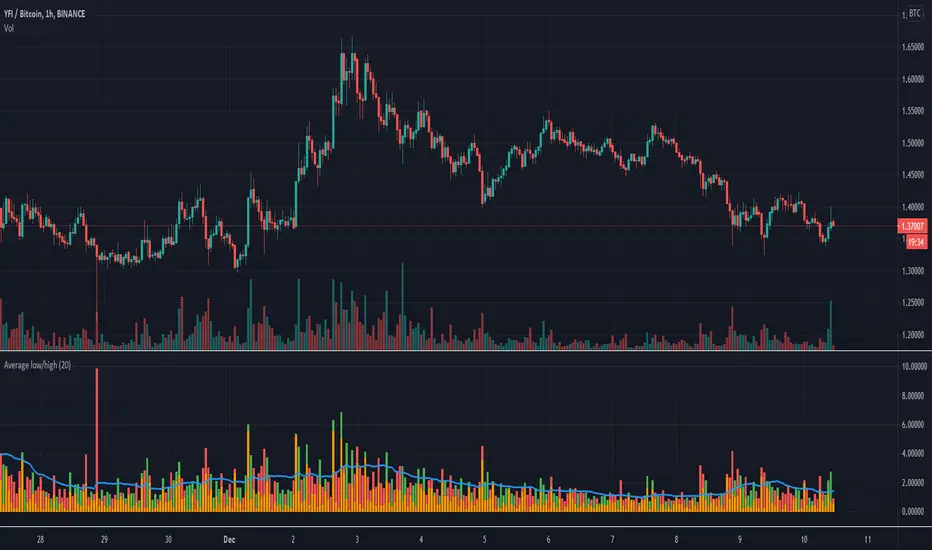
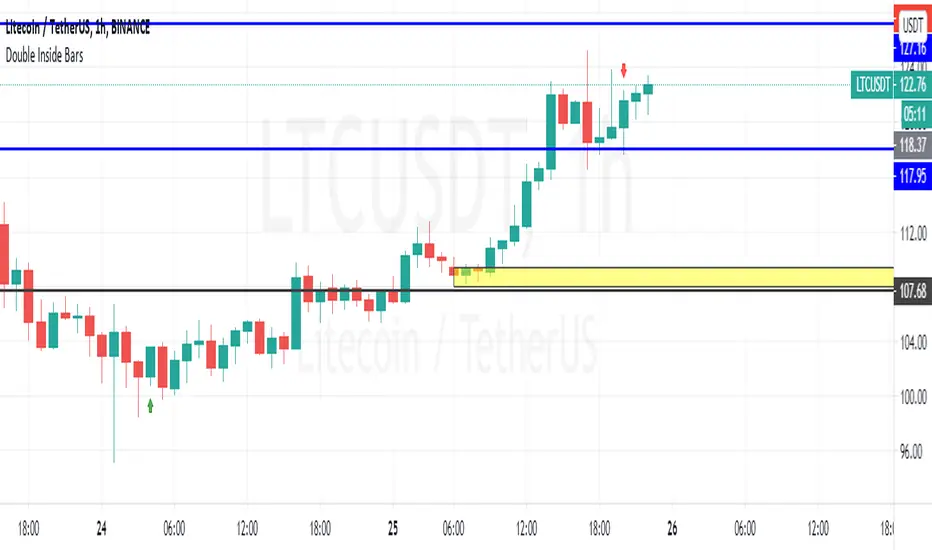
Double Inside BarsShows possible 4th bar movement direction based on 2 previous bars inside the 1st one
Divergence for Many Indicators v4Hello Traders,
Here is my new year gift for the community, Digergence for Many Indicators v4 . I tried to make it modular and readable as much as I can. Thanks to Pine Team for improving Pine Platform all the time!
How it works?
- On each candle it checks divergences between current and any of last 16 Pivot Points for the indicators.
- it search divergence on choisen indicators => RSI , MACD , MACD Histogram, Stochastic , CCI , Momentum, OBV, VWMACD, CMF and any External Indicator !
- it checks following divergences for 16 pivot points that is in last 100 bars for each Indicator.
--> Regular Positive Digergences
--> Regular Negative Digergences
--> Hidden Positive Digergences
--> Hidden Negative Digergences
- for positive divergences first it checks if closing price is higher than last closing price and indicator value is higher than perious value, then start searching divergence
- for negative divergences first it checks if closing price is lower than last closing price and indicator value is lower than perious value, then start searching divergence
Some Options:
Pivot Period: you set Pivot Period as you wish. you can see Pivot Points using "Show Pivot Points" option
Source for Pivot Points: you can use Close or High/Low as source
Divergence Type: you can choose Divergence type to be shown => "Regular", "Hidden", "Regular/Hidden"
Show Indicator Names: you have different options to show indicator names => "Full", "First Letter", "Don't Show"
Show Divergence Number: option to see number of indicators which has Divergence
Show Only Last Divergence : if you enable this option then it shows only last Positive and Negative Divergences
you can include any External Indicator to see if there is divergence
- enable "Check External Indicator"
- and then choose External indicator name in the list, "External Indicator"
- External indicator name is shown as Extrn
- related external indicator must be added before enabling this option
Coloring, line width and line style options for different type of divergences.
Following Alerts added:
- Positive Regular Divergence Detected
- Negative Regular Divergence Detected
- Positive Hidden Divergence Detected
- Negative Hidden Divergence Detected
Now lets see some examples:
Hidden Divergences:
Regular and Hidden Divergences together:
Showing first letters of indicators:
You can see only the number of indicators which has divergence:
You can see only divergence lines without indicators names and numbers:
option to used different label/line/text colors:
You have option to see only last divergences:
You can change Pivot Period, in following example Pivot Period = 15:
You can use Close or High/Low as Source for Divergence
You can include external indicators and get divergences on it:
Wish you all a happy new year!
Enjoy!

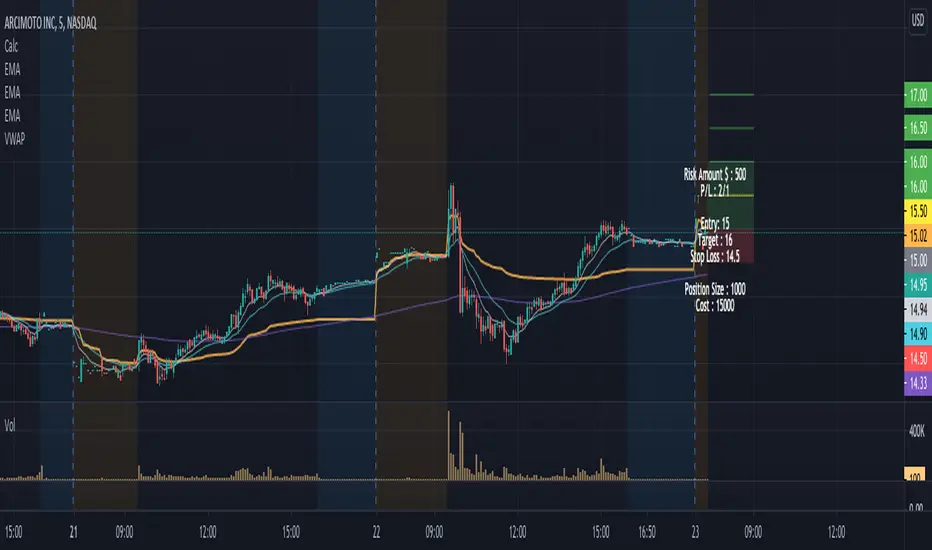
Position Size Calculator w/ profit targetsThis script helps the user visualize profit targets and calculates position size based on the input risk amount.
Input variables:
- Risk amount
- Entry price
- Stop loss amount
- Profit target amount
Calculated variables:
- Profit loss ratio
- Position size
- Postion cost
Plotted variables:
- shaded: entry price --> price target (green filled)
- shaded: entry price --> stop loss target (red filled)
- 1:1 p/l ratio --> yellow line
- 2:1, 3:1, 4:1 p/l ratios --> green lines
Overlay text can be toggled on/off in parameter input section
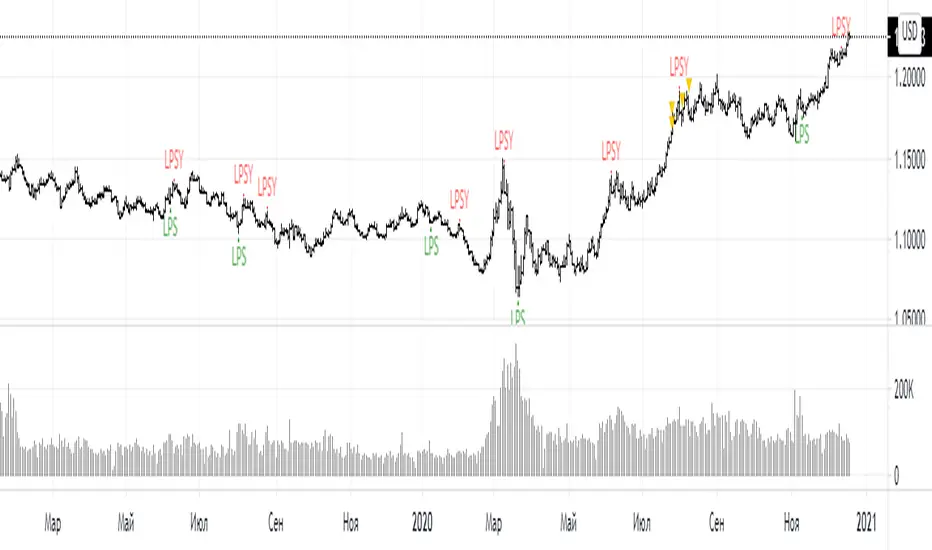
LPS PLSY INDICATOR for VSA( Google translation from Russian.)
Signal conditions:
1. There is a bar with an increased volume
2. The next bar after the bar with increased volume closes in the other direction
Arguments:
Comparison period - the period during which the volumes are compared with each other to calculate the bars with the increased volume.
sensitivity of increased volumes - according to the percentrank indicator - the border above which the volume will be considered large, the same as in the Volume on bar VSA indicator - indicator V2 - for clarity of how it works, I recommend looking at it.
efficiency of the next bar - (efficiency of the next bar from 0 to 100) ") - the efficiency of buying or selling on the next bar, bar field with a large volume. If the value is closer to 100, then the bars whose spread corresponds to the inserted volume will be taken into account, if closer to 0, then bars with a small spread and a large volume can be taken into account.
This argument is calculated similarly to the efficiency of bulls and bears for VSA
Attention.
In its original form, this indicator can give a large number of false signals. To filter out false signals, it should be used after studying the theory of VSA.
Russian language
Условия для сигнала:
1. Имеется бар с повышенным объёмом
2. Следующий бар после бара с повышенным объемом закрывается в другую сторону
Аргументы:
период для сравнения – период, на котором сравниваются между собой объёмы, для вычисления баров с повышенным объемом.
чувствительность повышенных объемов – согласно индикатору percentrank – граница выше которой̆ объем будет считаться большим, то же самое, что в индикаторе Volume on bar VSA - indicator V2 – для наглядности как это работает рекомендую посмотреть его.
эффективность следующего бара от 0 до 100 - эффективность покупок или продаж на следующем баре, поле бара с большим объемом. Если значение ближе к 100 то будут учитываться бары у которых спред соответствует вложенному объему, если ближе к 0 то могут учитываться бары у которых спред маленький а объем большой.
Расчёт этого аргумента производится аналогично индикатору efficiency of bulls and bears for VSA
Примечание
В исходном виде этот индикатор может давать большое количество ложных сигналов. Для отсеивания ложных сигналов его следует применять после изучения теории VSA.
ProjectionGreetings Traders! I have decided to release a few scripts as open-source as I'm sure others can benefit from them and perhaps make them better.(Be sure to check my Profile for the other scripts as well: www.tradingview.com).
This one is called Projection.
Projection is based off the same Principle as some of my other scripts, such as Trade Manager() and Price Predictor(). I use a simple concept using line.new() to define some potential Price Projections. From the Settings of the Indicator, you can access a couple different Pre-Set options.
Wide Parabola:
Skinny Parabola:
Straight Triangle:
ZigZag1:
ZigZag2:
I wanted to give a Special Thanks to @Pinecoders for the custom RoundToTick Function from Backtesting/Trading Engine --> ()
If you like Projection, be sure to Like, Follow, and if you have any questions, don't be afraid to drop a comment below.

User-Inputed Time Range & FibsGreetings Traders! I have decided to release a few scripts as open-source as I'm sure others can benefit from them and perhaps make them better.(Be sure to check my Profile for the other scripts as well: www.tradingview.com).
This one is called User-Inputed Time Range & Fibs.
The idea behind this script is to record the Range Highs and Lows of a User Defined Period, and plot potential Targets based on either Fibonacci Extensions or a Multiple of the Range Size. I created this originally for use with the US Session Initial Balance(From 9:30-10:30AM EST), however it can be set to any time period.
What is Initial Balance? In simple words, Initial Balance (IB) is the price data, which are formed during the first hour of a trading session. Activity of traders forms the so-called Initial Balance at this time. This concept was introduced for the first time by Peter Steidlmayer when he presented the market profile to traders(atas.net).
The IB is monitored as a break-out area for Range Extension traders. The IB High is also seen as an area of resistance and the IB Low as an area of support until it is broken(www.mypivots.com).
As a note, depending on the Time Zone you are in, you may need to manually add or subtract from the Timed Range to match the desired Time. For example in NY Eastern Time, I have to use 8:30-9:30AM to Capture the 9:30-10-30AM IB for ES and NQ. Similarly, I must use 14:30-15:30PM to Capture the 9:30-10-30AM IB for BTC. You will need to make adjustments based on the Time Zone you are located in.
I wanted to give a Special Thanks to @PineCoders for the Custom Rounding Function from Backtesting/Trading Engine--> (), Pinecoders.com for help with Tracking the Highs/Lows--> (www.pinecoders.com), and @TradeChartist for allowing me to use some of the code for the Fibonacci Extensions from his script here--> ().
If you like User-Inputed Time Range & Fibs, be sure to Like, Follow, and if you have any questions, don't be afraid to drop a comment below.

Price PredictorGreetings Traders! I have decided to release a few scripts as open-source as I'm sure others can benefit from them and perhaps make them better.(Be sure to check my Profile for the other scripts as well: www.tradingview.com).
This one is called Price Predictor.
How To Use Price Predictor
Price Predictor acquires potential targets by measuring the Average Change of Price from a user-defined resolution, from Open to Open. By default, the Resolution is set to 1 Day, however you can play around with Weekly, Monthly, etc. When a new resolution period begins, Price Predictor will automatically adjust based on the new Average Change of Price.
Due to the avoidance of Security() in this script, you may have to play around with the Timeframe that you use it in to ensure that you have enough bars on your chart to process the User-Defined Resolution.
The first Target Zone represents Target 5 of my other script, Trade Manager()(Given that you set the Target Multiple and Default Threshold Inputs as the same in each script), and is the most likely to be hit before the end of the resolution period.
In addition to a User-Defined Resolution, you also have the option of using a Custom Price to define Target Zones, however I'd recommend using my other script, Trade Manager(), if the volatility of the Instrument isn't too high.
I wanted to give a Special Thanks to @Pinecoders for the Custom RoundToTick Function from The Backtesting/Trading Engine --> (
If you like Price Predictor, be sure to Like, Follow, and if you have any questions, don't be afraid to drop a comment below.

Trade ManagerGreetings Traders! I have decided to release a few scripts as open-source as I'm sure others can benefit from them and perhaps make them better.(Be sure to check my Profile for the other scripts as well: www.tradingview.com).
This one is called Trade Manager.
How To Use Trade Manager
Trade Manager acquires potential targets by measuring the Average Change of Price from a user-defined resolution, from Open to Open. By default, the Resolution is set to 1 Day, however you can play around with Weekly, Monthly, etc. When a new resolution period begins, Trade Manager will automatically adjust its Targets based on the new Average Change of Price.
Due to the avoidance of Security() in this script, you may have to play around with the Timeframe that you use it in to ensure that you have enough bars on your chart to process the User-Defined Resolution.
The idea behind Trade Manager is quite simple yet can be quite powerful at the same time. Consider a Daily Candle for example. You can clearly see how a vast amount of price movement can be encapsulated within it, sometimes in both directions. By measuring the Average Change of Price per day(From Open to Open), we can use this Average to build targets off of. Defining a small Threshold above and below the Open Price of the Daily Candle allows you to set Limit Orders at these levels with predefined Targets. Then, the use of the custom Trailing Stop and Break Even helps to secure profits without giving too much back to the market, all while managing your risk.
Within the Settings of Trade Manager, you have the option to alter the logic of whether Break-Even is set after the first Target or second Target is hit.
In addition to using a User-Defined Resolution Period, you can also input a Custom Price into the settings of Trade Manager and allow the Targets, Trailing Stop, and Break Even to be calculated from the Custom Price.
I wanted to give a Special Thanks to @PineCoders for the Custom RoundToTick Function from The Backtesting/Trading Engine --> ()
As a note, there are times where price will break out very strongly from the Limit Price, sometimes crossing the Stop and Limit Price on the same bar. When this happens, it is difficult for Pine to determine which occurred first intra-bar, and as a result, it does not record a new position. In these instances, I'd recommend adjusting the Default Stop Multiple so it is below the bar.
If you like Trade Manager, be sure to Like, Follow, and if you have any questions, don't be afraid to drop a comment below.

RSI_OverValue with Engulfing candleThis script detects potential trend reverse and Buy or Sell spots.
It works with finding overvalued RSI and Engulfing candle after that and plotting "Buy" or "Sell" signal on price chart.
* Users can change RSI values easily from setting.
Enjoy

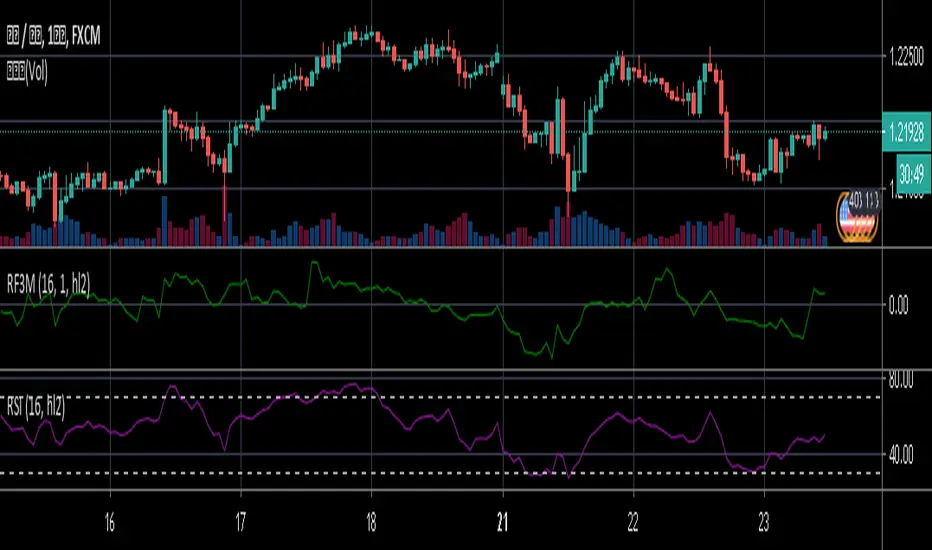
Relative Falling three Methods IndicatorAbstract
This script measure the related speed between rising and falling.
This script can replace binary Falling Three Methods detector and, report continuous value and estimate potential trend direction.
My suggestion of using this script is combining it with trading emotion.
Introduction
Falling Three Methods (F3M) is a candlestick pattern.
Many trading courses say traders can regard it as predicting falling will continue.
However, it is not easy to see perfect Falling Three Methods pattern from charts.
Therefore, we need an alternative method to measure it.
We can use the observation that falling is faster than rising during those time.
When falling is faster than rising, some long ( buy , call , higher , upper ) position owners may worry the price will fall very much suddenly.
When rising is faster than falling, some traders may worry they may miss buy opportunities.
Computing Related Falling Three Methods Indicator
(1) The value of rising and falling
In this script, open price is replaced with previous close price.
If the previous price is equal to the close price, than both rising and falling are equal to high-low.
If the previous price is lower than the close price, than the falling value becomes smaller, high-close+previous-low.
If the previous price is higher than the close price, than the rising value becomes smaller, high-previous+close-low.
(2) Area of value (aov)
Area of value is equal to highest-lowest. The previous close price is included.
(3) Compute weight and filter noise
We need a threshold for the noise filter. The default setting is aov/length, where length means how many days are counted.
When a rising or falling value <= threshold, it is not counted.
When a rising or falling value > threshold, the counted value = original value - threshold
and its weight = min ( counted value , threshold )
(4) compute speed
Rising speed = sum ( counted rising value ) / sum ( rising weight )
Falling speed = sum ( counted falling value ) / sum ( falling weight )
(5) Final result
Final result = Rising speed / ( Rising speed + Falling speed ) * 100 - 50
I move the middle level to 0 because 0 axis is always visible unless you cannot see negative values or you cannot see positive values.
Parameters
Length : how many days are counted. The default value is 16 just because 16=4*4, using binary characteristic.
Multi : the multiplier of noise threshold. Threshold applied = default threshold * multi
src : current not used
Conclusion
Related Falling Three Methods Indicator can measure the related speed between rising and falling.
I hope this indicator can help us to evaluate the possibility of trend continue or reversal and potential breakout direction.
After all, we care how trading emotion control the price movement and therefore we can take advantage to it.
Reference
How to trade with Falling Three Methods pattern
How to trade with Related Strength Indicator
Fibonacci Pivots Monthly and Weekly Full (no history)Fibonacci Pivots Monthly and Weekly Full (no history)
Inspired by FxChartAnalyst trader, with his great Monthly Weekly Daily Pivot Points Standard indicator
www.tradingview.com
This indicator calculates and plots both Monthly and Weekly pivots on a chart. Pivots are based on the Fibonacci ratios of the previous Month/Week candle close.
Good luck everyone!

Fibonacci Pivots Daily Full (no history)Inspired by FxChartAnalyst trader here, with his great Monthly Weekly Daily Pivot Points Standard indicator
www.tradingview.com
This one calculates Fibonacci ratios only and plots pivots based on the previous Daily close candle.

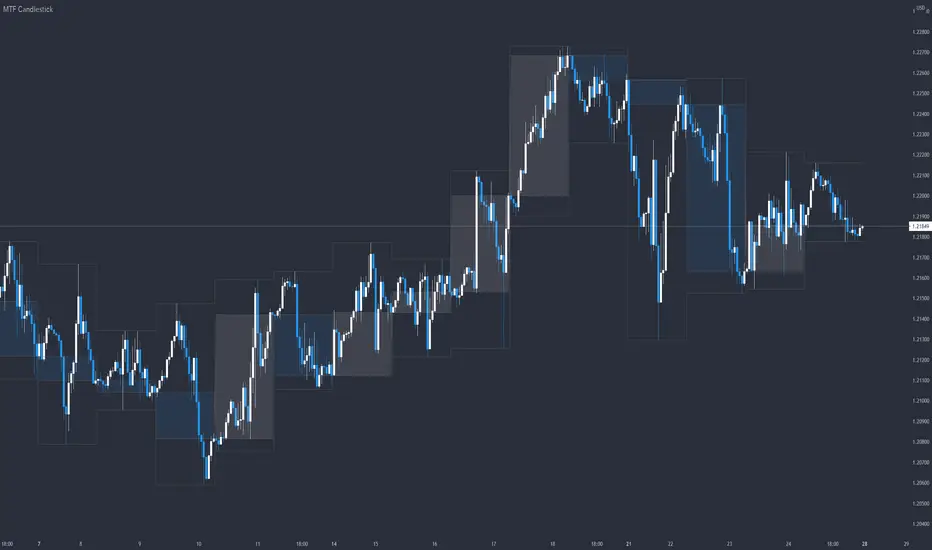
MTF CandlestickOne of the most important thing to understand in order to estimate the trend direction and its continuation is how the lower time frame candlesticks have been formed.
There are many processes by which candlesticks have been formed even if same size.
So in this script, daily candlestick is overlapped on the currently chart as default, and that can be changed.
Only real body is shown so as not to interfere with the currently chart.
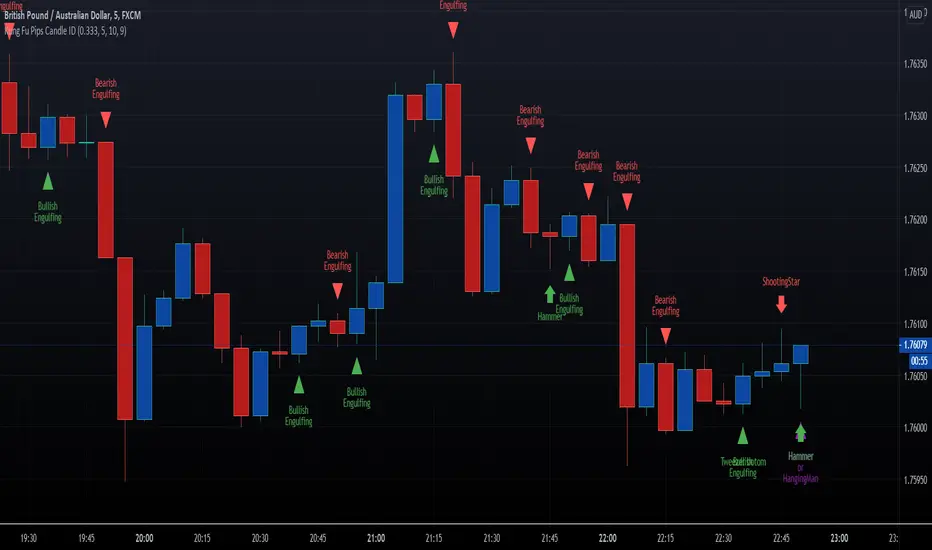
HFX Kung Fu Pips Candlestick Identifier by Trader ZThis indicator identifies the following candle stick patterns:
Bullish and Bearish Engulfing
Hammer/Hanging Man, Shooting Star
Tweezer Tops and Bottoms
Doji Star
Doji Gravestone
Made for trading Forex Binary Options but can be used in any market. When the candlestick pattern emerges the script will label the pattern. A helpful visual tool for your analysis.
Enjoy!!!!
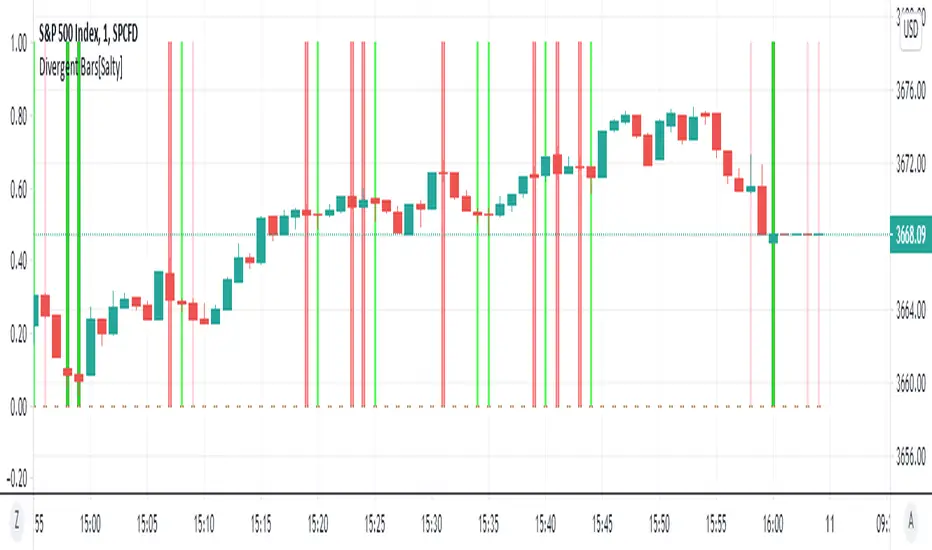
Divergent Bars[Salty]Updated an existing Divergent Bar script to be able to show all divergent bars. There are 2 set of divergent bars that can be turned on. The original one based on price and alligator lines, and a new second one that shows ALL divergent bars. The second set has lighter lines and colors to differentiate them from the filtered alligator divergent bars.
Candle Height in Percentage - ColumnsThis indicator calculates the difference in percentage between lows and highs of a candle. The orange bars show the height of the candle body (open/close) and the red/green on top show the percentage of the wicks (high/low). This assists in understanding the volatility of an asset. Showing this in percentages is more helpful in crypto. It also shows the Simple Moving Average of this data with the blue line.