Naked Bar Upward ReversalAMEX:SPY
The Naked Bar Upward Reversal is a three bar candlestick pattern with an inside candle as a entry point. This pattern is bullish since it has a candle closing red from the previous candle; the most bearish pattern possible. The following inside candle is a reversal of its previous candle with an open above the previous candle's close. Look to buy the next open above the inside candle's close.
This is a bullish reversal pattern and should be used in this context. Successful entries are found in corrections along an upward trend, or buying into a dip. Performance drops when the pattern appears at tops. To improve profitability, use a cluster of evidence to enhance the performance of this pattern. The intended time frame is within the daily and weekly.
تحليل الشموع اليابانية

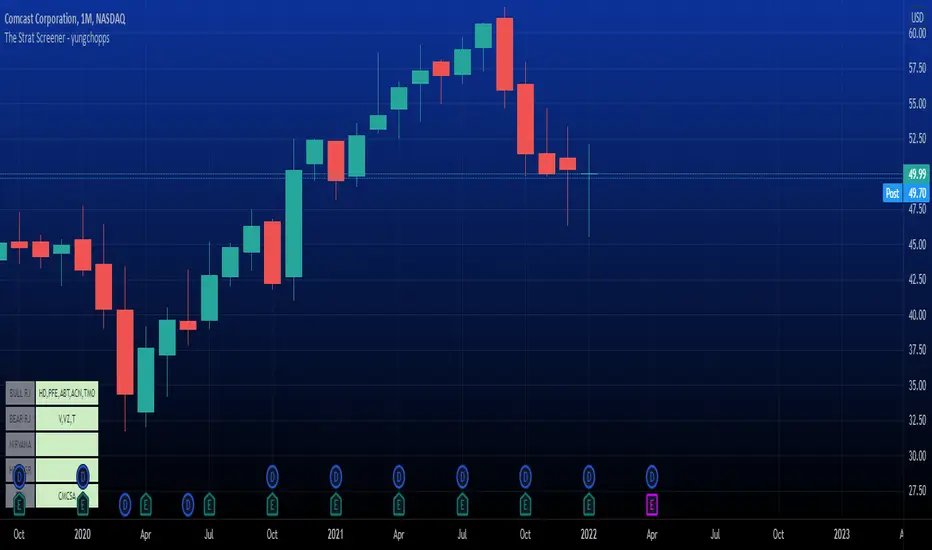
The Strat Screener - yungchoppsThis indicator scan up to 40 tickers of your choice for bullish and bearish Randy Jackson setups. Randy Jackson setups are 2u-2u-2d-2u for bullish cases and 2d-2d-2u-2d for bearish cases. If a ticker has a possible RJ setup, the ticker name will be display on the table depending if it is bullish or bearish. The only thing you need to do it change one of the default tickers to the ones you desire and the table will update if there are any RJ setups. The indicators search for RJ setups on the current timeframe that you are on.
Randy Jackson setups are part of the 'Strat' candlestick analysist. More information about the Strat can be found on the internet and YouTube. This indicator reads the previous candles of every selected ticker and searched for a RJ setup. If one exist, it will update the table with the tickers name. I will add more setups in the future.
This is a screener. This indicator really just makes it easier to scan many indicators at once. Its not hard to use... just place it on the chart and it will do the work for you. Hopefully mods find this enough of a description...
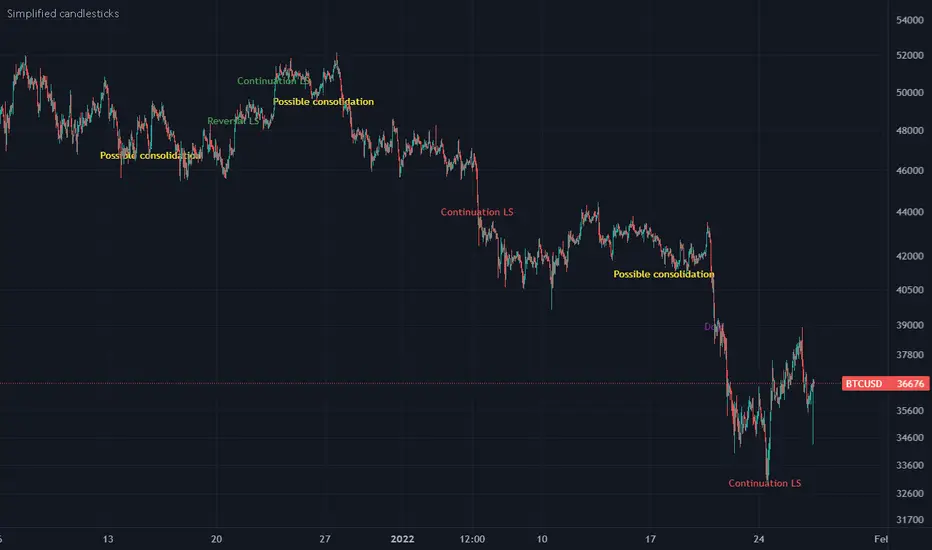
Simplified candlesticksSimplified candlesticks tracks sticks for their body and wick
- For Long bars sticks ( LS ) tracks and marks them on down trend as continuation and reversal if moves appositive direction.
- For largest wicks on ends marks as regular Doji
- For large wicks and medium body marks as possible consolidation
- For only bottom bigger wick as bears weakness if trend down and possible reversal if trend is up.
- For only upper bigger wick as bulls weakness if trend up and possible reversal if trend is down
DOJI FU IndicatorIndicator is designed to paint a doji, the size of which can be adjusted in settings.
Provided there is a valid doji, the following candle is a 'FU candle' or an 'Institution' candle. This candle wicks above/below the doji and takes liquidity from above or below.
Colours can be changed
Red = Doji candle
Yellow = FU candle
Example shown on the 1hr chart, red doji indicating a change of trend upwards, the FU candle (yellow) takes liquidity from above and sweeps down.

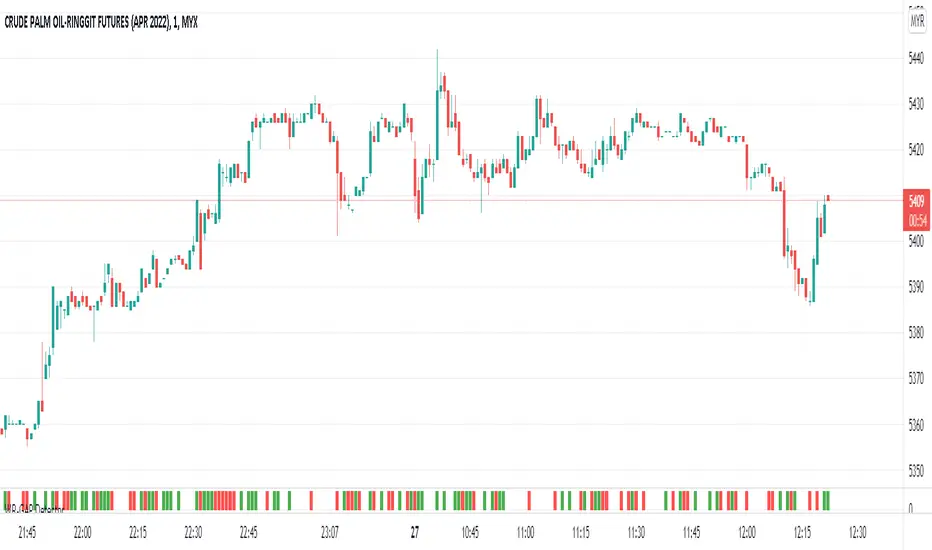
WR-GAP DetectorIndicator that plot if price gap detected.
Gap Up detected when open current candle more than close previous candle.
Gap Down detected when open current candle less than close previous candle.
Consolidation Zone Hunter NPR BasedThis script will search for zones where the range between the high and low is lower than avg % nearest rank of last X bars.
After X(=30) bars of consolidating range it will signal that the market is in a range and draw the top, bottom and middle of that range.
When price breaks the consolidating range the range is cleared, this is where you long/short the breakout. After this it will look for the next range and do the same.
Visual Explanation

Trade Manager Pro - Quick Position Sizing This script allows the user to select directly on the chart the entry time/candle for a trade, its entry price, stop loss price and take profit price, and will quickly calculate the position size for the trade.
Some of the parameters that can be established by the trader in the indicator settings include the following:
-Account Size
-Leverage Multiple
-Risk % per trade
-% Trading Fee
A table with the outputs will be shown to the right of the chart, showing the following information:
-Margin used for the trade
-Leverage
-Total position size (Margin*Leverage)
-Position Type (Long or Short)
-Trading Fee $
-Stop Loss %
-Stop Loss $
-Take Profit %
-Take Profit $
-Risk/Reward Ratio
Note on its usage: When changing timeframes or tickers its better to exit the indicator and add it again to the chart, since TV doesnt reset its input functions when changing these.
Happy trading!!

[DisDev] 12 Candle|Round#|Future SessionsThis indicator has many components; below, each component is explained and how it can be used as a trading tool.
1) Future Lines
a. Vertical lines are projected into the future to mark the beginning of each of the three major markets, Tokyo, London, and New York.
b. When major markets open, this can cause an increase in price action. So this component provides the trader with a reminder of when the next major market opens.
c. Also, the days of the week are displayed to allow the user to backtest price reaction for certain days of the week easily (e.g., Major Markets reopening after the weekend).
2) 12 Hour Candle Sessions High and Low
a. As price intersects with the beginning of the session, the vertical line disappears, and two corresponding horizontal lines begin. These horizontal lines dynamically adjust to mark each session's high and low, and a semi-transparent box fills the space between the high and low lines.
b. The duration of each session is a three-hour window, which each consists of 12 Fifteen-Minute Candles. This marks the hour prior to equity markets open, the opening hour, and the post-open hour.
c. The sessions highs and lows can be selected within the settings show for a 24 hour period. This assists the trader with session range breakouts; three examples of how this could be traded are below.
Example 1
d. The Tokyo and London session high kept the price action within a range. Once it broke the range, the Tokyo and London session highs were used as support, resulting in a range breakout.
Example 2
e. The below picture shows price action failing to break London Session Low and New York Session High; this is followed by Tokyo Low acting as resistance and price moving down 9%.
Example 3
f. Below price action with an increased volume of 323% (based on the average of the last 10 bar) fails to break the Tokyo High on the 1st attempt. The second attempt fails on 241% volume. The third attempt at 475% breaks the range, completing the range breakout seeing a move of 3.4% in price.
4) High of Day (HOD) and Low of Day (LOD)
a. As the trading day unfolds, we mark the HOD (d-High) and LOD (d-Low) with blue dotted horizontal lines. Then at the start of the next trading day, the former High and Low become the Previous Day High (pd-High) and Low (pd-Low) and are changed to dashes.
b. These high and low levels add extra confluence with the session high and lows for Swing Failure Patterns (SFP) and confirmation of trends.
5) Round Numbers
a. As humans, it's hard to use just any number to make sense of things. We prefer to use round numbers. This is important for trading as many traders will automatically use round numbers as their stop losses.
b. This indicator component reminds users of this fact and displays round numbers such as 00, 25, 50, and 75. The indicator automatically calculates and displays lines for the round numbers for as many as twelve levels above and below the current price.
c. Below are examples of how round numbers are broken to trigger stop losses; you may want to break the habit of using round numbers as your stop losses.
Below is the indicator in full swing, displaying all the elements described above.

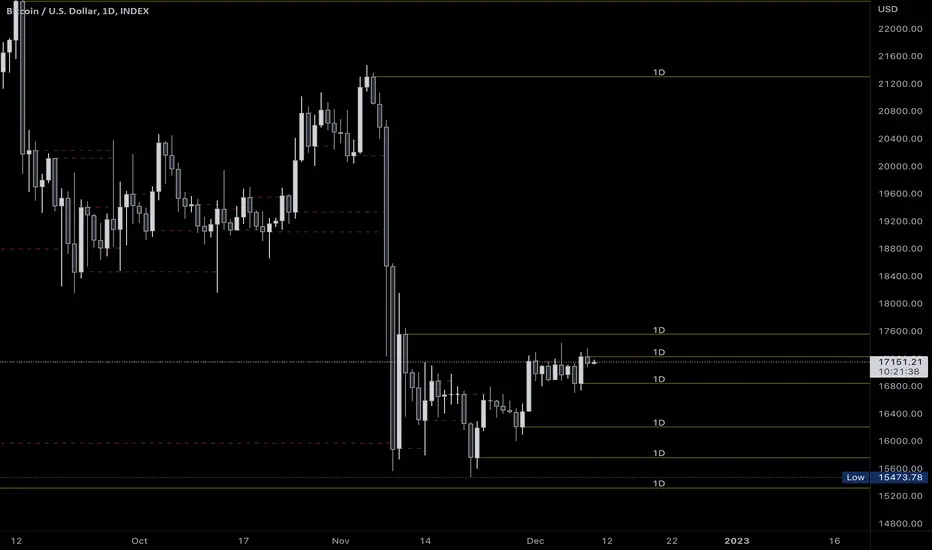
[BFR] Naked LevelsDetects significant naked levels(Levels that have not been touched since the candle closed) and draws them on chart. These provide excellent profit targets and often reversal levels.
Roadmap:
✅ Candle open
☑ Point of control
☑ Multiple timeframes
☑ Something else? Leave a comment.
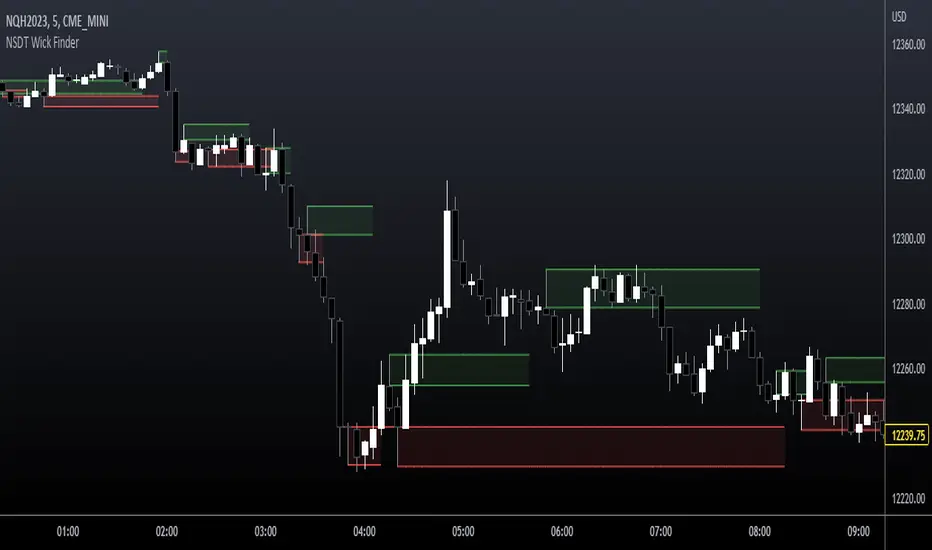
NSDT Wick FinderThis script finds wicks that are longer than the candle body and marks them as potential trading zones to be revisited. Lines, shading, and lookback can all be modified.
Full credit for original code goes to @Squam_Gobaloochee. We updated to Pinescript V5 and cleaned up code. We reached out to original for permission to repost publicly and open source.
J-BUY & SELLIntroduction
I have been tracking the technical indicator for a long time. In my experience, I have tried various combinations of the existing indicators in the chart but have not been able to get satisfactory results.
The trend analysis method needs a lot of focus and time. Therefore, rather than speculating the future trend, I focused on building a code which will be continuous in terms of indications and remove the speculation out of the strategy. Hence, allow for automation.
Indicator Strategy
This is a simple, yet powerful indicator primarily based on price action and its relationship with SMAs .
Each candle is compared with the moving averages and the output is shown as a buy and sell signal through Up & Down arrows. Up arrow is a buy indicator and Down arrow is a sell indicator.
However, you might see in some case there is no Buy or Sell signals indication on the candle. No worries, please follow the previous signal in these cases.
How to add the indicator into your chart
1. Click the “Indicators” tab in the Trading view chart Tool Bar.
2. In the “Indicator & Strategies” menu, click on Public Library option.
3. Search for the “J-BUY & SELL” in the search box.
4. Add the indicator by clicking on the result.
How to add Buy & Sell alert
In addition to the indicator, you can also set BUY & SELL alerts for any of the stock/ index/ commodities etc.
1. Hover your mouse cursor over the indicator on the chart.
2. Click on the three dots captioned as “More”
3. Choose the option “Add alert on J-BUY & SELL”
4. You can choose the alert “Buy Bar/ Sell Bar or both as per your requirement by pressing the “Create” button.
Change the Color of the Up & Down arrows
For changing the color of the arrows, please “double click” on the arrow and the color as per your choice.

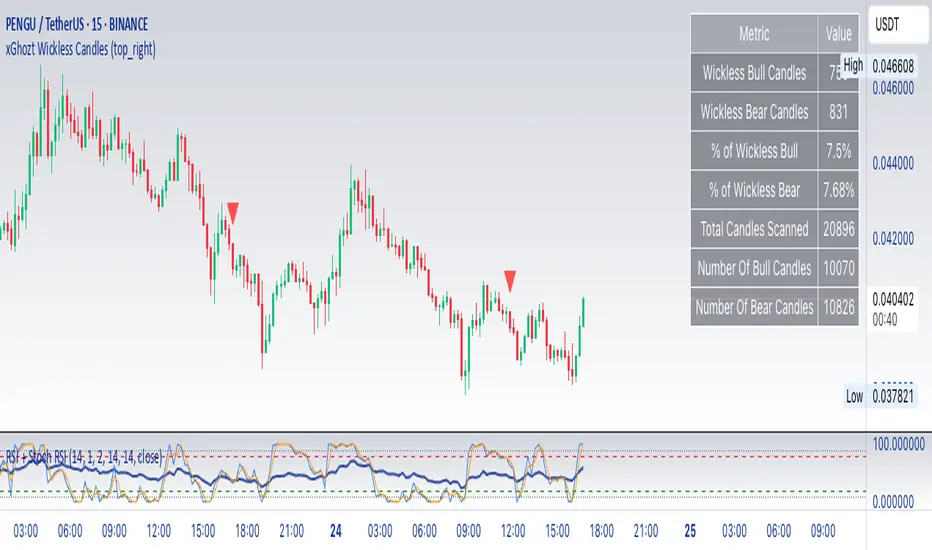
xGhozt Wickless CandlesSimple script showing candles missing an upper or downer wick. As candles tend to have a low and a high, they will most certainly form wicks. It is rare to have wickless candles on longer time frames, so it's more relevant on 1h and above.
What can you do about it?
If you see for example a Bitcoin 4h candle that hasn't form two wicks yet, there are high chances that the missing wick will be formed at one point or another, therefore you could take a trade in the direction of the missing wick. You can set alerts on wickless candles if needed.
The Strat Numbers & CombosThis indicator is an all-in-one " The Strat " script. This script displays the following:
The Strat candle numbers (1's, 2's, & 3's)
The Strat Combo labels along with trigger line
Pivot Machine Gun ( PMG ) dynamic labels
Hammer & Shooter candle labels
The Strat Candle Numbers label each candle, on any timeframe, either a 1, 2, or 3. 1's are inside bars of the previous candles. 2's take out only one side of the previous candle. And 3's go outside both sides of the previous candle.
The Strat Combo labels (which are made of the 1's, 2's, 3's outlined above) display labels when a Strat Combo occurs. The script displays a label, direction arrow, and trigger line for each Strat Combo. This indicator finds the following Strat Combos:
2-1-2 bullish reversal (BLR)
2-1-2 bullish continuation (BLC)
3-1-2 BLR
3-2-2 BLR
1-2-2 rev strat BLR
2-2 BLR
2-1-2 bearish reversal (BRR)
2-1-2 bearish continuation (BRC)
3-1-2 BRR
3-2-2 BRR
1-2-2 rev strat BRR
2-2 BRR
Double inside candles
The Pivot Machine Gun (PMG) labels any 5 or more consecutive candles that make higher lows or 5 or more consecutive candles that make lower highs. A PMG can continue going in its direction or it can reverse and come back through the range. The logic in this indicator dynamically finds each level in a PMG and draws a line for easy identification.
The script also identifies if the candle type is a Hammer, Inverted Hammer, Shooting Star, or Hanging Man. These candle types are highly likely reversal points in price action.The indicator will plot a shape with a color coded icon identifying the candle. The distance between the shape and the candles can be manually adjusted in the inputs section.
This indicator has many style options . The user can independently toggle on/off the Strat numbers, boxes around the Strat Combos, and Hammer and Shooter shapes. Also all of the colors used in this script can be changed from the inputs section, so a user can easily change colors to match their current color scheme.

RSI true swingsRelative Strength Index (RSI) is being used by majority of the traders to get benefitted based on the swings. But these swings are hard to Identify.
This Indicator uses 4 major factors for finding the potential reversal points:
RSI Crossover or crossunder
Relative volume
Overall volume against the moving average volume
Relative closing of the candles
Size of the bars
Please read Instructions carefully before using this indicator
Recommended entry is the OHLC4 of the signal bars.
If signal bar is too large, try to enter in the retracement when another signal comes either through indicator or through types of bars
when signals comes opposite to the trend, then try to wait for the next signal of same type. This creates a RSI-price divergence in confirmation by volume price action
Timeframe can be of your choice
Recommended stoploss should be swing highs or lows

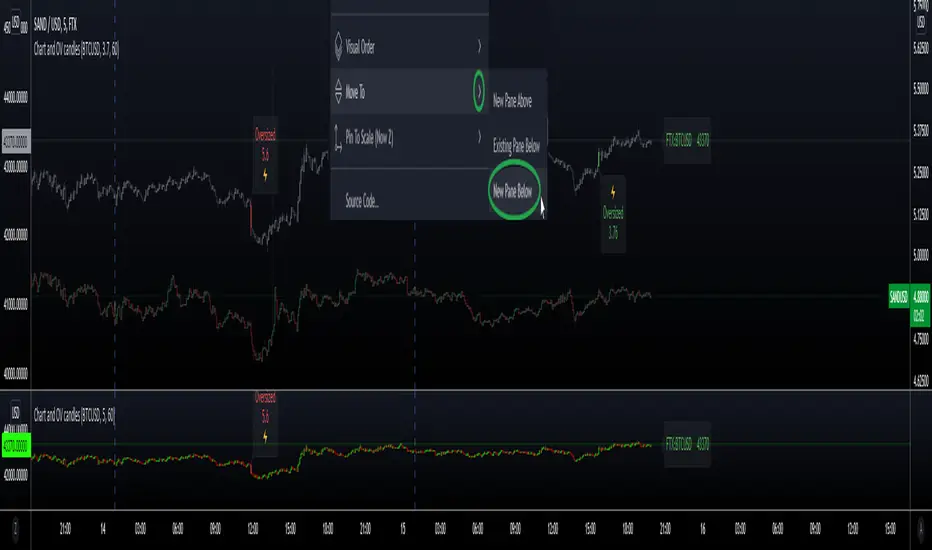
Secondary Chart with OverSized CandlesHi everyone, I'm sharing a simple script I made for a friend. He was looking for a way to add another asset to his chart, and monitor relevant movements \ spot eventual correlation, especially when trading Cryptocurrencies.
We couldn't find a similar script already available so here it is - the code is commented and I hope it's clear enough :)
Notes:
- The parameter scale = scale.left keeps the scales separated and therefore the chart is more organized, otherwise the chart would appear flat if the price difference is too big (e.g. BTC vs XRP)
- It is possible to have the script running in a separate panel (instead of overlay) by moving it to a new pane (when added to the chart) or by removing the parameter overlay = true at the beginning of the code.
- In case you wish to add indicators to this sub-chart (e.g. Bollinger Bands, EMA, etc..) you can do that by adding the relevant code and feed it with the variables OPEN \ HIGH \ LOW \ CLOSE as well as using the same method to retrieve new variables from the target asset with the request.security function.
Hope this comes handy.
Val - Protervus
SVDThis indicator aims to compare between two charts if trader isn't sure which one is more active and powerful, it does NOT show entries or help your chart analysis directly.
The main features of this indicator is to show vitality and range of any given chart.
Volatility: it calculates the average profit of every swing in the range and the final result will be the chart volatility, which indicate how profitable this chart is.
Range: it calculates the profit of the whole range compared to the total price. (E.g. range bottom is 0.1 and range top is 0.2 the range will be 100%)
Extra: indicator shows the total direction of the chart in term of (STRONG UPTREND, UPTREND, SIDEWAYS, DOWNTREND, STRONG DOWNTREND), if you got (Somthing_wrong) please contact me.
How to use: apply the indicator on different charts that you have chosen and the higher (volatility & range) the more profitable the chart is.
inputs:
Lookback length: how long the range is (how many candles are included).
How intense should the Swing be: how many candles should be counted as a confirmation complete swing.
Show counted Swings: if checked as true, will show the swings counted in the volatility calculation.
For any notes on the indicator to be edited, or for another indicator ideas please comment.

HTF Candles & PivotsThis indicator displays HTF candles and pivot points.
The candles are displayed in a box and you can select Open-Close, High-Low or both.
You can show all of the past, or just "today only" or "previous day only".
You can also shift one previous candle to the current one.
The pivot point is the normal one.
There is an option to display CPR (Central pivot range).
Example: Shift previous to current

Manual Backtest - Flat the ChartThis script is an utility tool for manual backtesting.
The main problem in backtesting a discretionary strategy is the bias of knowing the future result of the market, in this way all the market will be crushed into a flat line, this way you can avoid bias.
The way to use this indicator is easy and made by 4 step:
Step 1 : add to an asset you won't backtest and put the auto scale on
Step 2 : go to the asset you will backtest and scroll left until the date you want to start
Step 3 : use the replay function of tradingview (15 min chart won't go back more than 18 month)
Step 4: toggle off the indicator or remove from the chart (untill next asset to backtest)
That's not a complex indicator but is what you need to do a fair backtesting

*SSS 50% [4/8/D/W]** SSS 50% - 4HR, 8HR, Day and Week Timeframe Edition **
This indicator is based on Sara Strat Sniper's - 50% Rule for trading Outside Bars and helps you visual the method quickly.
As per user request this indicator allows you to select: Outside 4HR, 8HR, Daily and Weekly 50% Levels with Previous High and Low Levels, available within the indicators settings.
Please note - Daily 50% warning and high/low levels are set to the indicators default. Feel free to change and save as required. Any issues let me know.
** Indicator Setup Requirements **
For Indicator to correctly display the 50% price level you need to setup your chart correctly. Right-click your chart background, select Settings, select Scales and Tick “Indicator Last Value Label". Now your 50% Price level will be displayed.

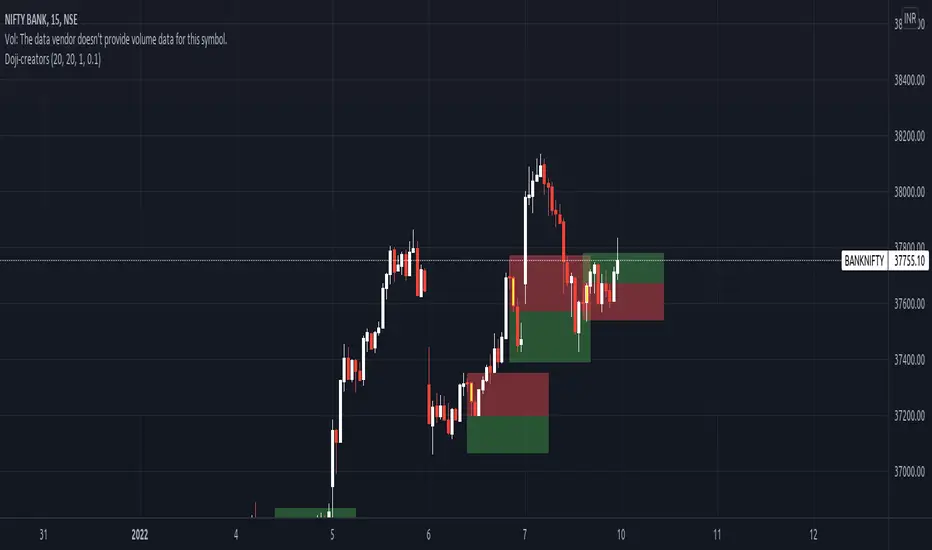
Doji-creatorsFinds doji and its breakout. It'll find the doji, detect the breakout and alert the user. Also will tell the possible reward based of rr ratio.
MTF Market Structure Highs and LowsThe indicator marks the last fractal highs and lows (W,D,4H and 1H options) to help determine current market structure. The script was created to help with directional bias but also as a MTF visual aid for stop hunts/liquidity raids.
Liquidity areas are where we assume trader's stop losses would be when buying or selling. Liquidity lies above and below swing points and institutions need liquidity to fill large orders.
Monitor price action as it hits these areas for a potential reversal trade.

Sessions with High/Low DiffThe main purpose of this indicator is to facilitate backtesting, but it may also be useful for traders to easily identify the current
active/open trading sessions on lower-timeframe charts.
This indicator also tracks the session high/low difference and plots it as a label on the last candle of the session once the last
bar of that session has finished printing and a new candle opened. The position and direction of the label is based on the
session open and close - if the session open is greater than the session close (which would equate to the equivalent of a red candle),
the label will be printed UNDER the last candle, and vice versa if the session close is above the session open.
The number printed inside the label is the difference between the session high and the session low, scaled to the minimum tick value of the chart.
Note #1: There is a Pinescript maximum of 500 labels allowed on any chart. While I could have gotten fancy and done some wizardry with label arrays,
I didn't really see a point to it. If labels are enabled for all 4 sessions at the same time, that would still have them available for the past 125
sessions, which would be about 6 months (approx 252 trading days per year, and this would cover 125 of them). If you limit to 2 sessions, you double
your potential look-back to almost a year (250 days out of the 252 average trading days each year), and for a single session, you double it yet again
to just under 2 years.
Note #2: As this indicator tracks open, high, low, and close for each session, it can potentially be enhanced (or forked) to construct "session candles".
I'm not sure what use this would be to anyone, but the pieces are there should someone find a use for it.
While it would be easy to add alerts on sessions opening/closing, I didn't see a purpose or value in that as it would be little more than a
glorified alarm clock. If I get enough demand to add them, I will gladly consider it.

Synthetic Price Action GeneratorNOTICE:
First thing you need to know, it "DOES NOT" reflect the price of the ticker you will load it on. THIS IS NOT AN INDICATOR FOR TRADING! It's a developer tool solely generating random values that look exactly like the fractals we observe every single day. This script's generated candles are as fake as the never ending garbage news cycles we are often force fed and expected to believe by using carefully scripted narratives peddled as hypnotic truth to psychologically and emotionally influence you to the point of control by coercion and subjugation. I wanted to make the script's synthetic nature very clear using that analogy, it's dynamically artificial. Do not accidentally become disillusioned by this scripts values, make trading decisions from it, and lastly don't become victim to predatory media magic ministry parrots with pretty, handsome smiles, compelling you to board their ferris wheel of fear. Now, on to the good stuff...
BACKSTORY:
Occasionally I find myself in situations where I have to build analyzers in Pine to actually build novel quantitative analytic indicators and tools worthy of future use. These analyzers certainly don't exist on this platform, but usually are required to engineer and tweak algorithms of the highest quality with the finest computational caliber. I have numerous other synthesizers to publish besides this one.
For many reasons, I needed a synthetic environment to utilize the analyzers I built in Pine, to even pursue building some exotic indicators and algorithms. Pine doesn't allow sourcing of tuples. Not to mention, I required numerous Pine advancements to make long held dreams into tangible realities. Many Pine upgrades have arrived and MANY, MANY more are in need of implementation for all. Now that I have this, intending to use it in the future often when in need, you can now use it too. I do anticipate some skilled Pine poets will employ this intended handy utility to design and/or improved indicators for trading.
ORIGIN:
This was inspired by the brilliance from the world renowned ALGOmist John F. Ehlers, but it's taken on a completely alien form from its original DNA. Browsing on the internet for something else, I came across an article with a small code snippet, and I remembered an old wish of mine. I have long known that by flipping back and forth on specific tickers and timeframes in my Watchlist is not the most efficient way to evaluate indicators in multiple theatres of price action. I realized, I always wanted to possess and use this sort of tool, so... I put it into Pine form, but now have decided to inject it with Pine Script steroids. The outcome is highly mutable candle formations in a reusable mutagenic package, observable above and masquerading as genuine looking price candles.
OVERVIEW:
I guess you could call it a price action synthesizer, but I entitled it "Synthetic Price Action Generator" for those who may be searching for such a thing. You may find this more useful on the All or 5Y charts initially to witness indication from beginning (barstate.isfirst === barindex==0) to end (last_bar_index), but you may also use keyboard shortcuts + + to view the earliest plottable bars on any timeframe. I often use that keyboard shortcut to qualify an indicator through the entirety of it's runtime.
A lot can go wrong unexpectedly with indicator initialization, and you will never know it if you don't inspect it. Many recursively endowed Infinite Impulse Response (IIR) Filters can initialize with unintended results that minutely ring in slightly erroneous fashion for the entire runtime, beginning to end, causing deviations from "what should of been..." values with false signals. Looking closely at spg(), you will recognize that 3 EMAs are employed to manage and maintain randomness of CLOSE, HIGH, and LOW. In fact, any indicator's barindex==0 initialization can be inspected with the keyboard shortcuts above. If you see anything obviously strange in an authors indicator, please contact the developer if possible and respectfully notify them.
PURPOSE:
The primary intended application of this script, is to offer developers from advanced to even novice skill levels assistance with building next generation indicators. Mostly, it's purpose is for testing and troubleshooting indicators AND evaluating how they perform in a "manageable" randomized environment. Some times indicators flake out on rare but problematic price fluctuations, and this may help you with finding your issues/errata sooner than later. While the candles upon initial loading look pristine, by tweaking it to the minval/maxval parameters limits OR beyond with a few code modifications, you can generate unusual volatility, for instance... huge wicks. Limits of minval= and maxval= of are by default set to a comfort zone of operation. Massive wicks or candle bodies will undoubtedly affect your indication and often render them useless on tickers that exhibit that behavior, like WGMCF intraday currently.
Copy/paste boundaries are provided for relevant insertion into another script. Paste placement should happen at the very top of a script. Note that by overwriting the close, open, high, etc... values, your compiler will give you generous warnings of "variable shadowing" in abundance, but this is an expected part of applying it to your novel script, no worries. plotcandle() can be copied over too and enabled/disabled in Settings->Style. Always remember to fully remove this scripts' code and those assignments properly before actual trading use of your script occurs, AND specifically when publishing. The entirety of this provided code should never, never exist in a published indicator.
OTHER INTENTIONS:
Even though these are 100% synthetic generated price points, you will notice ALL of the fractal pseudo-patterns that commonly exist in the markets, are naturally occurring with this generator too. You can also swiftly immerse yourself in pattern recognition exercises with increased efficiency in real time by clicking any SPAG Setting in focus and then using the up/down arrow keys. I hope I explained potential uses adequately...
On a personal note, the existence of fractal symmetry often makes me wonder, do we truly live in a totality chaotic universe or is it ordered mathematically for some outcomes to a certain extent. I think both. My observations, it's a pre-deterministic reality completely influenced by infinitesimal amounts of sentient free will with unimaginable existing and emerging quantities. Some how an unknown mysterious mechanism governing the totality of universal physics and mathematics counts this 100.0% flawlessly and perpetually. Anyways, you can't change the past that long existed before your birth or even yesterday, but you can choose to dream, create, and forge the future into your desires and hopes. As always, shite always happens when your not looking for it. What you choose to do after stepping in it unintentionally... is totally up to you. :) Maybe this tool and tips provided will aid you in not stepping in an algo cachucha up to your ankles somehow.
SCRIPTING LESSONS PORTRAYED IN THIS SCRIPT:
Pine etiquette and code cleanliness
Overwrite capabilities of built-in Pine variables for testing indicators
Various techniques to organize Settings panel while providing ease of adjustment utility
Use of tooltip= to provide users adequate valuable information. Most people want to trade with indicators, not blindly make adjustments to them without any knowledge of their intended operation/effects
When available time provides itself, I will consider your inquiries, thoughts, and concepts presented below in the comments section, should you have any questions or comments regarding this indicator. When my indicators achieve more prevalent use by TV members , I may implement more ideas when they present themselves as worthy additions. Have a profitable future everyone!
