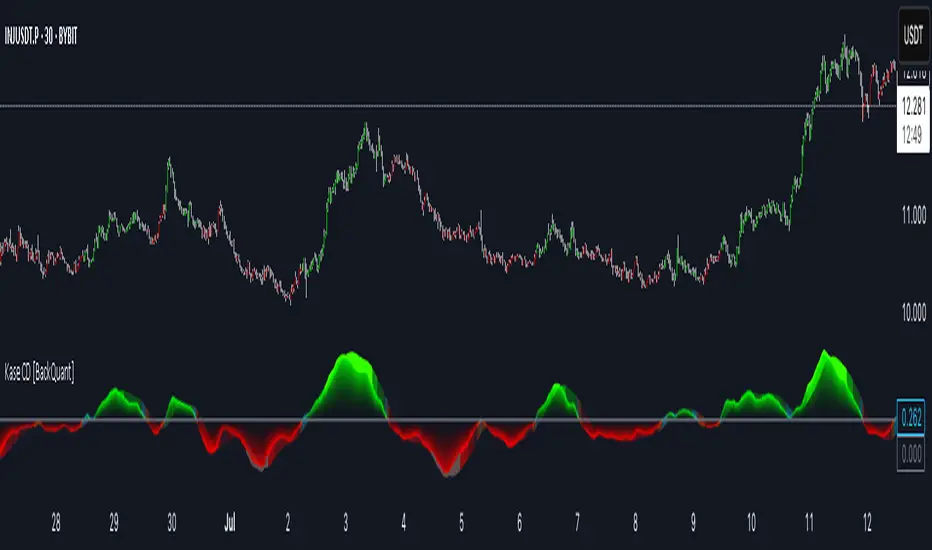
Kase Convergence Divergence [BackQuant]Kase Convergence Divergence
The Kase Convergence Divergence is a sophisticated oscillator designed to measure directional market strength through the lens of volatility-adjusted log return structures. Inspired by Cynthia Kase’s work on statistical momentum and price projection ranges, this unique indicator offers a hybrid framework that merges signal processing, multi-length sweep logic, and adaptive smoothing techniques.
Unlike traditional momentum oscillators like MACD or RSI, which rely on static moving average differences, KCD introduces a dual-process system combining:
Kase-style statistical range projection (via log returns and volatility),
A sweeping loop of lookback lengths for robustness,
First and second derivative modes to capture both velocity and acceleration of price movement.
Core Logic & Computation
The KCD calculation is centered on two volatility-normalized transforms:
KSDI Up: Measures how far the current high has moved relative to a past low, normalized by return volatility.
KSDI Down: Measures how far the current low has moved relative to a past high, also normalized.
For every length in a user-defined sweep range (e.g., 25–35), both KSDI_up and KSDI_dn are computed, and their maximum values across the loop are retained. The difference between these two max values produces the raw signal:
KPO (Kase Projection Oscillator): Measures directional skew.
KCD (Kase Convergence Divergence): Defined as KPO – MA(KPO) — similar in spirit to MACD but structurally different.
Users can choose to visualize either the first derivative (KPO) , or the second derivative (KCD) , depending on market conditions or strategy style.
Key Features
✅ Multi-Length Sweep Logic: Improves signal reliability by aggregating statistical range projections across a set of lookbacks.
✅ Advanced Smoothing Modes: Supports DEMA, HMA, TEMA, LINREG, WMA and more for dynamic adaptation.
✅ Dual Derivative Modes: Choose between speed (first derivative) or smoothness (second derivative) to fit your trading regime.
✅ Color-Encoded Signal Bands: Heatmap-style oscillator coloring enhances visual feedback on trend strength.
✅ Candlestick Painting: Optional bar coloring makes it easy to spot trend shifts on the main chart.
✅ Adaptive Fill Zones: Green and red fills between the oscillator and zero line help distinguish bullish and bearish regimes at a glance.
Practical Applications
📈 Trend Confirmation: Use KCD as a secondary confirmation layer after breakout or pullback entries.
📉 Momentum Shifts: Crossover and crossunder of the zero line highlight potential regime changes.
📊 Strategy Filters: Incorporate into algos to avoid trendless or mean-reverting environments.
🧪 Derivative Switching: Flip between KPO and KCD modes depending on whether you want to measure acceleration or deceleration of price flow.
Alerts & Signals
Two built-in alerts help you catch regime shifts in real time:
Long Signal: Triggered when the selected oscillator crosses above zero.
Short Signal: Triggered when it crosses below zero.
These events can be used to generate entries, exits, or trend validation cues in multi-layer systems.
Conclusion
The Kase Convergence Divergence goes beyond traditional oscillators by offering a volatility-normalized, derivative-aware signal engine with enhanced visual dynamics. Its sweeping architecture and dynamic fill logic make it especially powerful for identifying trending environments, filtering chop, and adding statistical rigor to your trading toolkit.
Whether you’re a discretionary trader seeking precision, or a quant looking to model more robust return structures, KCD offers a creative yet analytically grounded solution.
انفراج سعري
Divergence Strategy [Trendoscope®]🎲 Overview
The Divergence Strategy is a sophisticated TradingView strategy that enhances the Divergence Screener by adding automated trade signal generation, risk management, and trade visualization. It leverages the screener’s robust divergence detection to identify bullish, bearish, regular, and hidden divergences, then executes trades with precise entry, stop-loss, and take-profit levels. Designed for traders seeking automated trading solutions, this strategy offers customizable trade parameters and visual feedback to optimize performance across various markets and timeframes.
For core divergence detection features, including oscillator options, trend detection methods, zigzag pivot analysis, and visualization, refer to the Divergence Screener documentation. This description focuses on the strategy-specific enhancements for automated trading and risk management.
🎲 Strategy Features
🎯Automated Trade Signal Generation
Trade Direction Control : Restrict trades to long-only or short-only to align with market bias or strategy goals, preventing conflicting orders.
Divergence Type Selection : Choose to trade regular divergences (bullish/bearish), hidden divergences, or both, targeting reversals or trend continuations.
Entry Type Options :
Cautious : Enters conservatively at pivot points and exits quickly to minimize risk exposure.
Confident : Enters aggressively at the latest price and holds longer to capture larger moves.
Mixed : Combines conservative entries with delayed exits for a balanced approach.
Market vs. Stop Orders: Opt for market orders for instant execution or stop orders for precise price entry.
🎯 Enhanced Risk Management
Risk/Reward Ratio : Define a risk-reward ratio (default: 2.0) to set profit targets relative to stop-loss levels, ensuring consistent trade sizing.
Bracket Orders : Trades include entry, stop-loss, and take-profit levels calculated from divergence pivot points, tailored to the entry type and risk-reward settings.
Stop-Loss Placement : Stops are strategically set (e.g., at recent pivot or last price point) based on entry type, balancing risk and trade validity.
Order Cancellation : Optionally cancel pending orders when a divergence is broken (e.g., price moves past the pivot in the wrong direction), reducing invalid trades. This feature is toggleable for flexibility.
🎯 Trade Visualization
Target and Stop Boxes : Displays take-profit (lime) and stop-loss (orange) levels as boxes on the price chart, extending 10 bars forward for clear visibility.
Dynamic Trade Updates : Trade visualizations are added, updated, or removed as trades are executed, canceled, or invalidated, ensuring accurate feedback.
Overlay Integration : Trade levels overlay the price chart, complementing the screener’s oscillator-based divergence lines and labels.
🎯 Strategy Default Configuration
Capital and Sizing : Set initial capital (default: $1,000,000) and position size (default: 20% of equity) for realistic backtesting.
Pyramiding : Allows up to 4 concurrent trades, enabling multiple divergence-based entries in trending markets.
Commission and Margin : Accounts for commission (default: 0.01%) and margin (100% for long/short) to reflect trading costs.
Performance Optimization : Processes up to 5,000 bars dynamically, balancing historical analysis and real-time execution.
🎲 Inputs and Configuration
🎯Trade Settings
Direction : Select Long or Short (default: Long).
Divergence : Trade Regular, Hidden, or Both divergence types (default: Both).
Entry/Exit Type : Choose Cautious, Confident, or Mixed (default: Cautious).
Risk/Reward : Set the risk-reward ratio for profit targets (default: 2.0).
Use Market Order : Enable market orders for immediate entry (default: false, uses limit orders).
Cancel On Break : Cancel pending orders when divergence is broken (default: true).
🎯Inherited Settings
The strategy inherits all inputs from the Divergence Screener, including:
Oscillator Settings : Oscillator type (e.g., RSI, CCI), length, and external oscillator option.
Trend Settings : Trend detection method (Zigzag, MA Difference, External), MA type, and length.
Zigzag Settings : Zigzag length (fixed repaint = true).
🎲 Entry/Exit Types for Divergence Scenarios
The Divergence Strategy offers three Entry/Exit Type options—Cautious, Confident, and Mixed—which determine how trades are entered and exited based on divergence pivot points. This section explains how these settings apply to different divergence scenarios, with placeholders for screenshots to illustrate each case.
The divergence pattern forms after 3 pivots. The stop and entry levels are formed on one of these levels based on Entry/Exit types.
🎯Bullish Divergence (Reversal)
A bullish divergence occurs when price forms a lower low, but the oscillator forms a higher low, signaling a potential upward reversal.
💎 Cautious:
Entry : At the pivot high point for a conservative entry.
Exit : Stop-loss at the last pivot point (previous low that is higher than the current pivot low); take-profit at risk-reward ratio. Canceled if price breaks below the pivot (if Cancel On Break is enabled).
Behavior : Enters after confirmation and exits quickly to limit downside risk.
💎Confident:
Entry : At the last pivot low, (previous low which is higher than the current pivot low) for an aggressive entry.
Exit : Stop-loss at recent pivot low, which is the lowest point; take-profit at risk-reward ratio. Canceled if price breaks below the pivot. (lazy exit)
Behavior : Enters early to capture trend continuation, holding longer for gains.
💎Mixed:
Entry : At the pivot high point (conservative).
Exit : Stop-loss at the recent pivot point that has resulted in lower low (lazy exit). Canceled if price breaks below the pivot.
Behavior : Balances entry caution with extended holding for trend continuation.
🎯Bearish Divergence (Reversal)
A bearish divergence occurs when price forms a higher high, but the oscillator forms a lower high, indicating a potential downward reversal.
💎Cautious:
Entry : At the pivot low point (lower high) for a conservative short entry.
Exit : Stop-loss at the previous pivot high point (previous high); take-profit at risk-reward ratio. Canceled if price breaks above the pivot (if Cancel On Break is enabled).
Behavior : Enters conservatively and exits quickly to minimize risk.
💎Confident:
Entry : At the last price point (previous high) for an aggressive short entry.
Exit : Stop-loss at the pivot point; take-profit at risk-reward ratio. Canceled if price breaks above the pivot.
Behavior : Enters early to maximize trend continuation, holding longer.
💎Mixed:
Entry : At the previous piot high point (conservative).
Exit : Stop-loss at the last price point (delayed exit). Canceled if price breaks above the pivot.
Behavior : Combines conservative entry with extended holding for downtrend gains.
🎯Bullish Hidden Divergence (Continuation)
A bullish hidden divergence occurs when price forms a higher low, but the oscillator forms a lower low, suggesting uptrend continuation. In case of Hidden bullish divergence, b]Entry is always on the previous pivot high (unless it is a market order)
💎Cautious:
Exit : Stop-loss at the recent pivot low point (higher than previous pivot low); take-profit at risk-reward ratio. Canceled if price breaks below the pivot (if Cancel On Break is enabled).
Behavior : Enters after confirmation and exits quickly to limit downside risk.
💎Confident:
Exit : Stop-loss at previous pivot low, which is the lowest point; take-profit at risk-reward ratio. Canceled if price breaks below the pivot. (lazy exit)
Behavior : Enters early to capture trend continuation, holding longer for gains.
🎯Bearish Hidden Divergence (Continuation)
A bearish hidden divergence occurs when price forms a lower high, but the oscillator forms a higher high, suggesting downtrend continuation. In case of Hidden Bearish divergence, b]Entry is always on the previous pivot low (unless it is a market order)
💎Cautious:
Exit : Stop-loss at the latest pivot high point (which is a lower high); take-profit at risk-reward ratio. Canceled if price breaks above the pivot (if Cancel On Break is enabled).
Behavior : Enters conservatively and exits quickly to minimize risk.
💎Confident/Mixed:
Exit : Stop-loss at the previous pivot high point; take-profit at risk-reward ratio. Canceled if price breaks above the pivot.
Behavior : Uses the late exit point to hold longer.
🎲 Usage Instructions
🎯Add to Chart:
Add the Divergence Strategy to your TradingView chart.
The oscillator and divergence signals appear in a separate pane, with trade levels (target/stop boxes) overlaid on the price chart.
🎯Configure Settings:
Adjust trade settings (direction, divergence type, entry type, risk-reward, market orders, cancel on break).
Modify inherited Divergence Screener settings (oscillator, trend method, zigzag length) as needed.
Enable/disable alerts for divergence notifications.
🎯Interpret Signals:
Long Trades: Triggered on bullish or bullish hidden divergences (if allowed), shown with green/lime lines and labels.
Short Trades: Triggered on bearish or bearish hidden divergences (if allowed), shown with red/orange lines and labels.
Monitor lime (target) and orange (stop) boxes for trade levels.
Review strategy performance metrics (e.g., profit/loss, win rate) in the strategy tester.
🎯Backtest and Optimize:
Use TradingView’s strategy tester to evaluate performance on historical data.
Fine-tune risk-reward, entry type, position sizing, and cancellation settings to suit your market and timeframe.
For questions, suggestions, or support, contact Trendoscope via TradingView or official support channels. Stay tuned for updates and enhancements to the Divergence Strategy!

Divergence Screener [Trendoscope®]🎲Overview
The Divergence Screener is a powerful TradingView indicator designed to detect and visualize bullish and bearish divergences, including hidden divergences, between price action and a user-selected oscillator. Built with flexibility in mind, it allows traders to customize the oscillator type, trend detection method, and other parameters to suit various trading strategies. The indicator is non-overlay, displaying divergence signals directly on the oscillator plot, with visual cues such as lines and labels on the chart for easy identification.
This indicator is ideal for traders seeking to identify potential reversal or continuation signals based on price-oscillator divergences. It supports multiple oscillators, trend detection methods, and alert configurations, making it versatile for different markets and timeframes.
🎲Features
🎯Customizable Oscillator Selection
Built-in Oscillators : Choose from a variety of oscillators including RSI, CCI, CMO, COG, MFI, ROC, Stochastic, and WPR.
External Oscillator Support : Users can input an external oscillator source, allowing integration with custom or third-party indicators.
Configurable Length : Adjust the oscillator’s period (e.g., 14 for RSI) to fine-tune sensitivity.
🎯Divergence Detection
The screener identifies four types of divergences:
Bullish Divergence : Price forms a lower low, but the oscillator forms a higher low, signaling potential upward reversal.
Bearish Divergence : Price forms a higher high, but the oscillator forms a lower high, indicating potential downward reversal.
Bullish Hidden Divergence : Price forms a higher low, but the oscillator forms a lower low, suggesting trend continuation in an uptrend.
Bearish Hidden Divergence : Price forms a lower high, but the oscillator forms a higher high, suggesting trend continuation in a downtrend.
🎯Flexible Trend Detection
The indicator offers three methods to determine the trend context for divergence detection:
Zigzag : Uses zigzag pivots to identify trends based on higher highs (HH), higher lows (HL), lower highs (LH), and lower lows (LL).
MA Difference : Calculates the trend based on the difference in a moving average (e.g., SMA, EMA) between divergence pivots.
External Trend Signal : Allows users to input an external trend signal (positive for uptrend, negative for downtrend) for custom trend analysis.
🎯Zigzag-Based Pivot Analysis
Customizable Zigzag Length : Adjust the zigzag length (default: 13) to control the sensitivity of pivot detection.
Repaint Option : Choose whether divergence lines repaint based on the latest data or wait for confirmed pivots, balancing responsiveness and reliability.
🎯Visual and Alert Features
Divergence Visualization : Divergence lines are drawn between price pivots and oscillator pivots, color-coded for easy identification:
Bullish Divergence : Green
Bearish Divergence : Red
Bullish Hidden Divergence : Lime
Bearish Hidden Divergence : Orange
Labels and Tooltips : Labels (e.g., “D” for divergence, “H” for hidden) appear on price and oscillator pivots, with tooltips providing detailed information such as price/oscillator values, ratios, and pivot directions.
Alerts : Configurable alerts for each divergence type (bullish, bearish, bullish hidden, bearish hidden) trigger on bar close, ensuring timely notifications.
🎲 How It Works
🎯Oscillator Calculation
The indicator calculates the selected oscillator (or uses an external source) and plots it on the chart.
Oscillator values are stored in a map for reference during divergence calculations.
🎯Pivot Detection
A zigzag algorithm identifies pivots in the oscillator data, with configurable length and repainting options.
Price and oscillator pivots are compared to detect divergences based on their direction and ratio.
🎯Divergence Identification
The indicator compares price and oscillator pivot directions (HH, HL, LH, LL) to identify divergences.
Trend context is determined using the selected method (Zigzag, MA Difference, or External).
Divergences are classified as bullish, bearish, bullish hidden, or bearish hidden based on price-oscillator relationships and trend direction.
🎯Visualization and Alerts
Valid divergences are drawn as lines connecting price and oscillator pivots, with corresponding labels.
Alerts are triggered for allowed divergence types, providing detailed information via tooltips.
🎯Validation
Divergence lines are validated to ensure no intermediate bars violate the divergence condition, enhancing signal reliability.
🎲 Usage Instructions as Indicator
🎯Add to Chart:
Add the “Divergence Screener ” to your TradingView chart.
The indicator appears in a separate pane below the price chart, plotting the oscillator and divergence signals.
🎯Configure Settings:
Adjust the oscillator type and length to match your trading style.
Select a trend detection method and configure related parameters (e.g., MA type/length or external signal).
Set the zigzag length and repainting preference.
Enable/disable alerts for specific divergence types.
I🎯nterpret Signals:
Bullish Divergence (Green) : Look for potential buy opportunities in a downtrend.
Bearish Divergence (Red) : Consider sell opportunities in an uptrend.
Bullish Hidden Divergence (Lime) : Confirm continuation in an uptrend.
Bearish Hidden Divergence (Orange): Confirm continuation in a downtrend.
Use tooltips on labels to review detailed pivot and divergence information.
🎯Set Alerts:
Create alerts for each divergence type to receive notifications via TradingView’s alert system.
Alerts include detailed text with price, oscillator, and divergence information.
🎲 Example Scenarios as Indicator
🎯 With External Oscillator (Use MACD Histogram as Oscillator)
In order to use MACD as an oscillator for divergence signal instead of the built in options, follow these steps.
Load MACD Indicator from Indicator library
From Indicator settings of Divergence Screener, set Use External Oscillator and select MACD Histograme from the dropdown
You can now see that the oscillator pane shows the data of selected MACD histogram and divergence signals are generated based on the external MACD histogram data.
🎯 With External Trend Signal (Supertrend Ladder ATR)
Now let's demonstrate how to use external direction signals using Supertrend Ladder ATR indicator. Please note that in order to use the indicator as trend source, the indicator should return positive integer for uptrend and negative integer for downtrend. Steps are as follows:
Load the desired trend indicator. In this example, we are using Supertrend Ladder ATR
From the settings of Divergence Screener, select "External" as Trend Detection Method
Select the trend detection plot Direction from the dropdown. You can now see that the divergence signals will rely on the new trend settings rather than the built in options.
🎲 Using the Script with Pine Screener
The primary purpose of the Divergence Screener is to enable traders to scan multiple instruments (e.g., stocks, ETFs, forex pairs) for divergence signals using TradingView’s Pine Screener, facilitating efficient comparison and identification of trading opportunities.
To use the Divergence Screener as a screener, follow these steps:
Add to Favorites : Add the Divergence Screener to your TradingView favorites to make it available in the Pine Screener.
Create a Watchlist : Build a watchlist containing the instruments (e.g., stocks, ETFs, or forex pairs) you want to scan for divergences.
Access Pine Screener : Navigate to the Pine Screener via TradingView’s main menu: Products -> Screeners -> Pine, or directly visit tradingview.com/pine-screener/.
Select Watchlist : Choose the watchlist you created from the Watchlist dropdown in the Pine Screener interface.
Choose Indicator : Select Divergence Screener from the Choose Indicator dropdown.
Configure Settings : Set the desired timeframe (e.g., 1 hour, 1 day) and adjust indicator settings such as oscillator type, zigzag length, or trend detection method as needed.
Select Filter Criteria : Select the condition on which the watchlist items needs to be filtered. Filtering can only be done on the plots defined in the script.
Run Scan : Press the Scan button to display divergence signals across the selected instruments. The screener will show which instruments exhibit bullish, bearish, bullish hidden, or bearish hidden divergences based on the configured settings.
🎲 Limitations and Possible Future Enhancements
Limitations are
Custom input for oscillator and trend detection cannot be used in pine screener.
Pine screener has max 500 bars available.
Repaint option is by default enabled. When in repaint mode expect the early signal but the signals are prone to repaint.
Possible future enhancements
Add more built-in options for oscillators and trend detection methods so that dependency on external indicators is limited
Multi level zigzag support

RSI Divergence (Nikko)RSI Divergence by Nikko
🧠 RSI Divergence Detector — Nikko Edition This script is an enhanced RSI Divergence detector built with Pine Script v6, modified for better visuals and practical usability. It uses linear regression to detect bullish and bearish divergences between the RSI and price action — one of the most reliable early signals in technical analysis.
✅ Improvements from the Original:
- Clean divergence lines using regression fitting.
- Optional label display to reduce clutter (Display Labels toggle).
- Adjustable line thickness (Display Line Width).
- A subtle heatmap background to highlight RSI overbought/oversold zones.
- Uses max accuracy with high calc_bars_count and custom extrapolation window.
🔍 How It Works: The script applies linear regression (least squares method) on both RSI data, and Price (close) data.
It then compares the direction of RSI vs. direction of Price over a set length. If price is making higher highs while RSI makes lower highs, it's a bearish divergence. If price is making lower lows while RSI makes higher lows, it's a bullish divergence. Additional filters (e.g., momentum and slope thresholds) are used to validate only strong divergences.
🔧 Input Parameters: RSI Length: The RSI period (default: 14). RSI Divergence Length: The lookback period for regression (default: 25). Source: Which price data to calculate RSI from (default: close). Display Labels: Show/hide “Bullish” or “Bearish” labels on the chart. Display Line Width: Adjusts how thick the plotted divergence lines appear.
📣 Alerts: Alerts are built-in for both RSI Buy (bullish divergence) and RSI Sell (bearish divergence) so you can use it in automation or notifications.
🚀 Personal Note: I’ve been using this script daily in my own trading, which is why I took time to improve both the logic and visual clarity. If you want a divergence tool that doesn't clutter your chart but gives strong signals, this might be what you're looking for.

Adaptive Cycle Oscillator with EMADescription of the Adaptive Cycle Oscillator with EMA Pine Script
This Pine Script, titled "Adaptive Cycle Oscillator with EMA", is a custom technical indicator designed for TradingView to help traders analyze market cycles and identify potential buy or sell opportunities. It combines an Adaptive Cycle Oscillator (ACO) with multiple Exponential Moving Averages (EMAs), displayed as colorful, wavy lines, and includes features like buy/sell signals and divergence detection. Below is a beginner-friendly explanation of how the script works, adhering to TradingView's Script Publishing Rules.
What This Indicator Does
The Adaptive Cycle Oscillator with EMA helps you:
Visualize market cycles using an oscillator that adapts to price movements.
Track trends with seven EMAs of different lengths, plotted as a rainbow of wavy lines.
Identify potential buy or sell signals when the oscillator crosses predefined thresholds.
Spot divergences between the oscillator and price to anticipate reversals.
Use customizable settings to adjust the indicator to your trading style.
Note: This is a technical analysis tool and does not guarantee profits. Always combine it with other analysis methods and practice risk management.
Step-by-Step Explanation for New Users
1. Understanding the Indicator
Adaptive Cycle Oscillator (ACO): The ACO analyzes price data (based on high, low, and close prices, or HLC3) to detect market cycles. It smooths price movements to create an oscillator that swings between overbought and oversold levels.
EMAs: Seven EMAs of different lengths are applied to the ACO and scaled based on the market's dominant cycle. These EMAs are plotted as colorful, wavy lines to show trend direction.
Buy/Sell Signals: The script generates signals when the ACO crosses above or below user-defined thresholds, indicating potential entry or exit points.
Divergence Detection: The script identifies bullish or bearish divergences between the ACO and the fastest EMA, which may signal potential reversals.
Visual Style: The indicator uses a rainbow of seven colors (red, orange, yellow, green, blue, indigo, violet) for the EMAs, with wavy lines for a unique visual effect. Static levels (zero, overbought, oversold) are also wavy for consistency.
2. How to Add the Indicator to Your Chart
Open TradingView and load the chart of any asset (e.g., stock, forex, crypto).
Click on the Indicators button at the top of the chart.
Search for "Adaptive Cycle Oscillator with EMA" (or paste the script into TradingView’s Pine Editor if you have access to it).
Click to add the indicator to your chart. It will appear in a separate panel below the price chart.
3. Customizing the Indicator
The script offers several input options to tailor it to your needs:
Base Cycle Length (Default: 20): Sets the initial period for calculating the dominant cycle. Higher values make the indicator slower; lower values make it more sensitive.
Alpha Smoothing (Default: 0.07): Controls how much the ACO smooths price data. Smaller values produce smoother results.
Show Buy/Sell Signals (Default: True): Toggle to display green triangles (buy) and red triangles (sell) on the chart.
Threshold (Default: 0.0): Defines overbought (above threshold) and oversold (below threshold) levels. Adjust to widen or narrow signal zones.
EMA Base Length (Default: 10): Sets the starting length for the fastest EMA. Other EMAs are incrementally longer (12, 14, 16, etc.).
Divergence Lookback (Default: 14): Determines how far back the script looks to detect divergences.
To adjust these:
Right-click the indicator on your chart and select Settings.
Modify the inputs in the pop-up window.
Click OK to apply changes.
4. Reading the Indicator
Oscillator and EMAs: The ACO and seven EMAs are plotted in a separate panel. The EMAs (colored lines) move in a wavy pattern:
Red (fastest) to Violet (slowest) represent different response speeds.
When the faster EMAs (e.g., red, orange) are above slower ones (e.g., blue, violet), it suggests bullish momentum, and vice versa.
Zero Line: A gray wavy line at zero acts as a neutral level. The ACO above zero indicates bullish conditions; below zero indicates bearish conditions.
Overbought/Oversold Lines: Red (overbought) and green (oversold) wavy lines mark threshold levels. Extreme ACO values near these lines may suggest reversals.
Buy/Sell Signals:
Green Triangle (Bottom): Appears when the ACO crosses above the oversold threshold, suggesting a potential buy.
Red Triangle (Top): Appears when the ACO crosses below the overbought threshold, suggesting a potential sell.
Divergences:
Green Triangle (Bottom): Indicates a bullish divergence (price makes a lower low, but the EMA makes a higher low), hinting at a potential upward reversal.
Red Triangle (Top): Indicates a bearish divergence (price makes a higher high, but the EMA makes a lower high), hinting at a potential downward reversal.
5. Using Alerts
You can set alerts for key events:
Right-click the indicator and select Add Alert.
Choose a condition (e.g., "ACO Buy Signal", "Bullish Divergence").
Configure the alert settings (e.g., notify via email, app, or pop-up).
Click Create to activate the alert.
Available alert conditions:
ACO Buy Signal: When the ACO crosses above the oversold threshold.
ACO Sell Signal: When the ACO crosses below the overbought threshold.
Bullish Divergence: When a potential upward reversal is detected.
Bearish Divergence: When a potential downward reversal is detected.
6. Tips for Using the Indicator
Combine with Other Tools: Use the indicator alongside support/resistance levels, candlestick patterns, or other indicators (e.g., RSI, MACD) for confirmation.
Test on Different Timeframes: The indicator works on any timeframe (e.g., 1-minute, daily). Shorter timeframes may produce more signals but with more noise.
Practice Risk Management: Never rely solely on this indicator. Set stop-losses and position sizes to manage risk.
Backtest First: Use TradingView’s Strategy Tester (if you convert the script to a strategy) to evaluate performance on historical data.
Compliance with TradingView’s Script Publishing Rules
This description adheres to TradingView’s Script Publishing Rules (as outlined in the provided link):
No Performance Claims: The description avoids promising profits or specific results, emphasizing that the indicator is a tool for analysis.
Clear Instructions: It provides step-by-step guidance for adding, customizing, and using the indicator.
Risk Disclaimer: It notes that trading involves risks and the indicator should be used with other analysis methods.
No Misleading Terms: Terms like “buy” and “sell” are used to describe signals, not guaranteed actions.
Transparency: The description explains the indicator’s components (ACO, EMAs, signals, divergences) without exaggerating its capabilities.
No External Links: The description avoids linking to external resources or soliciting users.
Educational Tone: It focuses on educating users about the indicator’s functionality.
Limitations
Not a Standalone System: The indicator is not a complete trading strategy. It provides insights but requires additional analysis.
Lagging Nature: As with most oscillators and EMAs, signals may lag behind price movements, especially in fast markets.
False Signals: Signals and divergences may not always lead to successful trades, particularly in choppy markets.
Market Dependency: Performance varies across assets and market conditions (e.g., trending vs. ranging markets).

Smarter Money Flow Divergence Detector [PhenLabs]📊 Smarter Money Flow Divergence Detector
Version: PineScript™ v6
📌 Description
SMFD was developed to help give you guys a better ability to “read” what is going on behind the scenes without directly having access to that level of data. SMFD is an enhanced divergence detection indicator that identifies money flow patterns from advanced volume analysis and price action correspondence. The detection portion of this indicator combines intelligent money flow calculations with multi timeframe volume analysis to help you see hidden accumulation and distribution phases before major price movements occur.
The indicator measures institutional trading activity by looking at volume surges, price volume dynamics, and the factors of momentum to construct an overall picture of market sentiment. It’s built to assist traders in identifying high probability entries by identifying if smart money is positioning against price action.
🚀 Points of Innovation
● Advanced Smart Money Flow algorithm with volume spike detection and large trade weighting
● Multi timeframe volume analysis for enhanced institutional activity detection
● Dynamic overbought/oversold zones that adapt to current market conditions
● Enhanced divergence detection with pivot confirmation and strength validation
● Color themes with customizable visual styling options
● Real time institutional bias tracking through accumulation/distribution analysis
🔧 Core Components
● Smart Money Flow Calculation: Combines price momentum, volume expansion, and VWAP analysis
● Institutional Bias Oscillator: Tracks accumulation/distribution patterns with volume pressure analysis
● Enhanced Divergence Engine: Detects bullish/bearish divergences with multiple confirmation factors
● Dynamic Zone Detection: Automatically adjusts overbought/oversold levels based on market volatility
● Volume Pressure Analysis: Measures buying vs selling pressure over configurable periods
● Multi factor Signal System: Generates entries with trend alignment and strength validation
🔥 Key Features
● Smart Money Flow Period: Configurable calculation period for institutional activity detection
● Volume Spike Threshold: Adjustable multiplier for detecting unusual institutional volume
● Large Trade Weight: Emphasis factor for high volume periods in flow calculations
● Pivot Detection: Customizable lookback period for accurate divergence identification
● Signal Sensitivity: Three tier system (Conservative/Medium/Aggressive) for signal generation
● Themes: Four color schemes optimized for different chart backgrounds
🎨 Visualization
● Main Oscillator: Line, Area, or Histogram display styles with dynamic color coding
● Institutional Bias Line: Real time tracking of accumulation/distribution phases
● Dynamic Zones: Adaptive overbought/oversold boundaries with gradient fills
● Divergence Lines: Automatic drawing of bullish/bearish divergence connections
● Entry Signals: Clear BUY/SELL labels with signal strength indicators
● Information Panel: Real time statistics and status updates in customizable positions
📖 Usage Guidelines
Algorithm Settings
● Smart Money Flow Period
○ Default: 20
○ Range: 5-100
○ Description: Controls the calculation period for institutional flow analysis.
Higher values provide smoother signals but reduce responsiveness to recent activity
● Volume Spike Threshold
○ Default: 1.8
○ Range: 1.0-5.0
○ Description: Multiplier for detecting unusual volume activity indicating institutional participation. Higher values require more extreme volume for detection
● Large Trade Weight
○ Default: 2.5
○ Range: 1.5-5.0
○ Description: Weight applied to high volume periods in smart money calculations. Increases emphasis on institutional sized transactions
Divergence Detection
● Pivot Detection Period
○ Default: 12
○ Range: 5-50
○ Description: Bars to analyze for pivot high/low identification.
Affects divergence accuracy and signal frequency
● Minimum Divergence Strength
○ Default: 0.25
○ Range: 0.1-1.0
○ Description: Required price change percentage for valid divergence patterns.
Higher values filter out weaker signals
✅ Best Use Cases
● Trading with intraday to daily timeframes for institutional position identification
● Confirming trend reversals when divergences align with support/resistance levels
● Entry timing in trending markets when institutional bias supports the direction
● Risk management by avoiding trades against strong institutional positioning
● Multi timeframe analysis combining short term signals with longer term bias
⚠️ Limitations
● Requires sufficient volume for accurate institutional detection in low volume markets
● Divergence signals may have false positives during highly volatile news events
● Best performance on liquid markets with consistent institutional participation
● Lagging nature of volume based calculations may delay signal generation
● Effectiveness reduced during low participation holiday periods
💡 What Makes This Unique
● Multi Factor Analysis: Combines volume, price, and momentum for comprehensive institutional detection
● Adaptive Zones: Dynamic overbought/oversold levels that adjust to market conditions
● Volume Intelligence: Advanced algorithms identify institutional sized transactions
● Professional Visualization: Multiple display styles with customizable themes
● Confirmation System: Multiple validation layers reduce false signal generation
🔬 How It Works
1. Volume Analysis Phase:
● Analyzes current volume against historical averages to identify institutional activity
● Applies multi timeframe analysis for enhanced detection accuracy
● Calculates volume pressure through buying vs selling momentum
2. Smart Money Flow Calculation:
● Combines typical price with volume weighted analysis
● Applies institutional trade weighting for high volume periods
● Generates directional flow based on price momentum and volume expansion
3. Divergence Detection Process:
● Identifies pivot highs/lows in both price and indicator values
● Validates divergence strength against minimum threshold requirements
● Confirms signals through multiple technical factors before generation
💡 Note: This indicator works best when combined with proper risk management and position sizing. The institutional bias component helps identify market sentiment shifts, while divergence signals provide specific entry opportunities. For optimal results, use on liquid markets with consistent institutional participation and combine with additional technical analysis methods.

Market Matrix ViewThis technical indicator is designed to provide traders with a quick and integrated view of market dynamics by combining several popular indicators into a single tool. It's not a magic bullet, but a practical aid for analyzing buying/selling pressure, trends, volume, and divergences, saving you time in the decision-making process. Built for flexibility, the indicator adapts to various trading styles (scalping, swing, or long-term) and offers customizable settings to suit your needs.
🟡 Multi-Timeframe Trends
➤ This section displays the trend direction (bullish, bearish, or neutral) across 15-minute, 1-hour, 4-hour, and Daily timeframes, providing multi-timeframe market context. Timeframes lower than the one currently selected will show "N/A."
➤It utilizes fast and slow Exponential Moving Averages (EMAs) for each timeframe:
15m: Fast EMA 42, Slow EMA 170
1h: Fast EMA 40, Slow EMA 100
4h: Fast EMA 36, Slow EMA 107
Daily: Fast EMA 20, Slow EMA 60
🟡 Smart Flow & RVOL
➤ This section displays "Buying Pressure" or "Selling Pressure" signals based on indicator confluence, alongside volume activity ("High Activity," "Normal Activity," or "Low Activity").
➤ Smart Flow combines Chaikin Money Flow (CMF) and Money Flow Index (MFI) to detect buying/selling pressure. CMF measures money flow based on price position within the high-low range, while MFI analyzes money flow considering typical price and volume. A signal is generated only when both indicators simultaneously increase/decrease beyond an adjustable threshold ("Buy/Sell Sensitivity") and volume exceeds a Simple Moving Average (SMA) scaled by the "Volume Multiplier."
➤ RVOL (Relative Volume) calculates relative volume separately for bullish and bearish candles, comparing recent volume (fast SMA) with a reference volume (slow SMA). Thresholds are adjusted based on the selected mode.
🟡 ADX & RSI
This section displays trend strength ("Strong," "Moderate," or "Weak"), its direction ("Bullish" or "Bearish"), and the RSI momentum status ("Overbought," "Oversold," "Buy/Sell Momentum," or "Neutral").
➤ ADX (Average Directional Index) measures trend strength (above 40 = "Strong," 20–40 = "Moderate," below 20 = "Weak"). Direction is determined by comparing +DI (upward movement) with -DI (downward movement). Additionally, an arrow indicates whether the trend's strength is decreasing or increasing.
➤RSI (Relative Strength Index) evaluates price momentum. Extreme levels (above 80/85 = "Overbought," below 15/20 = "Oversold") and intermediate zones (47–53 = "Neutral," above 53 = "Buy Momentum," below 47 = "Sell Momentum") are adjusted based on the selected mode.
🟡 When these signals are active for a potential trade setup, the table's background lights up green or red, respectively.
🟡 Volume Spikes
➤This feature highlights bars with significantly higher volume than the recent average, coloring them yellow on the chart to draw attention to intense market activity.
➤It uses the Z-Score method to detect volume anomalies. Current volume is compared to a 10-bar Simple Moving Average (SMA) and the standard deviation of volume over the same period. If the Z-Score exceeds a certain threshold, the bar is marked as a volume spike.
🟡 Divergences (Volume Divergence Detection)
➤ This feature marks divergences between price and technical indicators on the chart, using diamond-shaped labels (green for bullish divergences, red for bearish divergences) to signal potential trend reversals.
➤ It compares price deviations from a Simple Moving Average (SMA) with deviations of three indicators: Chaikin Money Flow (CMF), Money Flow Index (MFI), and On-Balance Volume (OBV). A bullish divergence occurs when price falls below its average, but CMF, MFI, and OBV rise above their averages, indicating hidden accumulation. A bearish divergence occurs when price rises above its average, but CMF, MFI, and OBV fall, suggesting distribution. The length of the moving averages is adjustable (default 13/10/5 bars for Scalping/Balanced/Swing), and detection thresholds are scaled by "Divergence Sensitivity" (default 1.0).
🟡 Adaptive Stop-Loss (ATR)
➤Draws dynamic stop-loss lines (red, dashed) on the chart for buy or sell signals, helping traders manage risk.Uses the Average True Range (ATR) to calculate stop-loss levels, set at low/high ± ATR × multiplier
🟡 Alerts for trend direction changes in the Info Panel:
➤ Triggers notifications when the trend shifts to Bullish (when +DI crosses above -DI) or Bearish (when +DI crosses below -DI), helping you stay informed about key market shifts.
How to use: Set alerts in Trading View for “Trend Changed to Bullish” or “Trend Changed to Bearish” with “Once Per Bar Close” for reliable signals.
🟡 Settings (Inputs)
➤ The indicator offers customizable settings to fit your trading style, but it's already optimized for Scalping (1m–15m), Balanced (16m–3h59m), and Swing (4h–Daily) modes, which automatically adjust based on the selected timeframe. The visible inputs allow you to adjust the following parameters:
Show Info Panel: Enables/disables the information panel (default: enabled).
Show Volume Spikes: Turns on/off coloring for volume spike bars (default: enabled).
Spike Sensitivity: Controls the Z-Score threshold for detecting volume spikes (default: 2.0; lower values increase signal frequency).
Show Divergence: Enables/disables the display of divergence labels (default: enabled).
Divergence Sensitivity: Adjusts the thresholds for divergence detection (default: 1.0; higher values reduce sensitivity).
Divergence Lookback Length: Sets the length of the moving averages used for divergences (default: 5, automatically adjusted to 13/10/5 for Scalping/Balanced/Swing).
RVOL Reference Period: Defines the reference period for relative volume (default: 20, automatically adjusted to 7/15/20).
RSI Length: Sets the RSI length (default: 14, automatically adjusted to 5/10/14).
Buy Sensitivity: Controls the increase threshold for Buying Pressure signals (default: 0.007; higher values reduce frequency).
Sell Sensitivity: Controls the decrease threshold for Selling Pressure signals (default: 0.007; higher values reduce frequency).
Volume Multiplier (B/S Pressure): Adjusts the volume threshold for Smart Flow signals (default: 0.6; higher values require greater volume).
🟡 This indicator is created to simplify market analysis, but I am not a professional in Pine Script or technical indicators. This indicator is not a standalone solution. For optimal results, it must be integrated into a well-defined trading strategy that includes risk management and other confirmations.

CDP - Counter-Directional-Pivot🎯 CDP - Counter-Directional-Pivot
📊 Overview
The Counter-Directional-Pivot (CDP) indicator calculates five critical price levels based on the previous day's OHLC data, specifically designed for multi-timeframe analysis. Unlike standard pivot points, CDP levels are calculated using a unique formula that identifies potential reversal zones where price action often changes direction.
⚡ What Makes This Script Original
This implementation solves several technical challenges that existing pivot indicators face:
🔄 Multi-Timeframe Consistency: Values remain identical across all timeframes (1m, 5m, 1h, daily) - a common problem with many pivot implementations
🔒 Intraday Stability: Uses advanced value-locking technology to prevent the "stepping" effect that occurs when pivot lines shift during the trading session
💪 Robust Data Handling: Optimized for both liquid and illiquid stocks with enhanced data synchronization
🧮 CDP Calculation Formula
The indicator calculates five key levels using the previous day's High (H), Low (L), and Close (C):
CDP = (H + L + C) ÷ 3 (Central Decision Point)
AH = 2×CDP + H – 2×L (Anchor High - Strong Resistance)
NH = 2×CDP – L (Near High - Moderate Resistance)
AL = 2×CDP – 2×H + L (Anchor Low - Strong Support)
NL = 2×CDP – H (Near Low - Moderate Support)
✨ Key Features
🎨 Visual Elements
📈 Five Distinct Price Levels: Each with customizable colors and line styles
🏷️ Smart Label System: Shows exact price values for each level
📋 Optional Value Table: Displays all levels in an organized table format
🎯 Clean Chart Display: Minimal visual clutter while maximizing information
⚙️ Technical Advantages
🔐 Session-Locked Values: Prices are locked at market open, preventing intraday shifts
🔄 Multi-Timeframe Sync: Perfect consistency between daily and intraday charts
✅ Data Validation: Built-in checks ensure reliable calculations
🚀 Performance Optimized: Efficient code structure for fast loading
💼 Trading Applications
🔄 Reversal Zones: AH and AL often act as strong turning points
💥 Breakout Confirmation: Price movement beyond these levels signals trend continuation
🛡️ Risk Management: Use levels for stop-loss and take-profit placement
🏗️ Market Structure: Understand daily ranges and potential price targets
📚 How to Use
🚀 Basic Setup
Add the indicator to your chart (works on any timeframe)
Customize colors for easy identification of support/resistance zones
Enable the value table for quick reference of exact price levels
📈 Trading Strategy Examples
🟢 Long Bias: Look for bounces at NL or AL levels
🔴 Short Bias: Watch for rejections at NH or AH levels
💥 Breakout Trading: Enter positions when price decisively breaks through anchor levels
↔️ Range Trading: Use CDP as the central reference point for range-bound markets
🎯 Advanced Strategy Combinations
RSI Integration for Enhanced Signals: 📊
📉 Oversold Bounces: Combine RSI below 30 with price touching AL/NL levels for high-probability long entries
📈 Overbought Rejections: Look for RSI above 70 with price rejecting AH/NH levels for short opportunities
🔍 Divergence Confirmation: When RSI shows bullish divergence at support levels (AL/NL) or bearish divergence at resistance levels (AH/NH), it often signals stronger reversal potential
⚡ Momentum Confluence: RSI crossing 50 while price breaks through CDP can confirm trend direction changes
⚙️ Configuration Options
🎨 Line Customization: Adjust width, style (solid/dashed/dotted), and colors
👁️ Display Preferences: Toggle individual levels, labels, and value table
📍 Table Position: Place the value table anywhere on your chart
🔔 Alert System: Get notifications when price crosses key levels
🔧 Technical Implementation Details
🎯 Data Reliability
The script uses request.security() with lookahead settings to ensure historical accuracy while maintaining real-time functionality. The value-locking mechanism prevents the common issue where pivot levels shift during the trading day.
🔄 Multi-Timeframe Logic
⏰ Intraday Charts: Display previous day's calculated levels as stable horizontal lines
📅 Daily Charts: Show current day's levels based on yesterday's OHLC
🔍 Consistency Check: All timeframes reference the same source data
🤔 Why CDP vs Standard Pivots?
Counter-Directional Pivots often provide more accurate reversal points than traditional pivot calculations because they incorporate the relationship between high/low ranges and closing prices more effectively. The formula creates levels that better reflect market psychology and institutional trading behaviors.
💡 Best Practices
💧 Use on liquid markets for most reliable results
📊 RSI Combination: Add RSI indicator for overbought/oversold confirmation and divergence analysis
📊 Combine with volume analysis for confirmation
🔍 Consider multiple timeframe analysis (daily levels on hourly charts)
📝 Test thoroughly in paper trading before live implementation
💪 Example Market Applications
NASDAQ:AAPL AAPL - Tech stock breakouts through AH levels
$NYSE:SPY SPY - Index trading with CDP range analysis
NASDAQ:TSLA TSLA - Volatile stock reversals at AL/NL levels
⚠️ This indicator is designed for educational and analytical purposes. Always combine with proper risk management and additional technical analysis tools.

TradeQUO Herrick Payoff RSIHerrick Payoff Index RSI (HPI-RSI) with Signal Line
An advanced oscillator that measures market strength not just by price, but by "smart money flow."
This indicator is not a typical RSI. Instead of applying the Relative Strength Index to price alone, it calculates it on the cumulative Herrick Payoff Index (HPI) . This creates a unique oscillator that reflects the underlying sentiment and capital flow in the market.
What is the Herrick Payoff Index (HPI)?
The HPI is a classic sentiment indicator that combines three crucial elements to determine if money is flowing into or out of an asset:
Price Change: The direction and momentum of the market.
Trading Volume: The conviction behind the price movement.
Open Interest (OI): The total number of open contracts (mainly in futures), which indicates if new capital is entering the market.
By combining these factors, the HPI provides a more comprehensive picture of market strength than indicators based solely on price.
How This Indicator Works
The script follows a logical, multi-step process:
It calculates the raw Herrick Payoff Index for each bar.
It creates a cumulative sum of this index to generate a continuous money flow value.
This cumulative value is smoothed with a short-period EMA to reduce noise.
The RSI is then applied to this smoothed HPI value.
An additional, configurable signal line (moving average) is added to facilitate trading signals.
Interpretation and Application
You can use this indicator much like a standard RSI, but with the added context of money flow:
Overbought/Oversold: Values above 70 suggest an overbought condition, while values below 30 signal an oversold condition.
Signal Line Crossovers: A cross of the HPI-RSI line above the signal line can be seen as a bullish signal. A cross below can be seen as a bearish signal.
Divergences: Look for divergences between the indicator and the price. A bullish divergence (price makes a lower low, indicator makes a higher low) can indicate an upcoming move to the upside. A bearish divergence (price makes a higher high, indicator makes a lower high) can signal a potential move to the downside.
Settings
The indicator has been deliberately kept simple:
HPI Smoothing Length: Smoothing length (1-5) for the cumulative HPI.
RSI Length: The lookback period for the RSI calculation.
Signal Line Settings: Here you can enable/disable the signal line and customize its type and length.
Display Settings: Adjust the colors of the RSI and signal lines to your preference.
This indicator is a tool for analysis and should always be used in combination with other methods and a solid risk management strategy. Happy trading!

Market Zone Analyzer[BullByte]Understanding the Market Zone Analyzer
---
1. Purpose of the Indicator
The Market Zone Analyzer is a Pine Script™ (version 6) indicator designed to streamline market analysis on TradingView. Rather than scanning multiple separate tools, it unifies four core dimensions—trend strength, momentum, price action, and market activity—into a single, consolidated view. By doing so, it helps traders:
• Save time by avoiding manual cross-referencing of disparate signals.
• Reduce decision-making errors that can arise from juggling multiple indicators.
• Gain a clear, reliable read on whether the market is in a bullish, bearish, or sideways phase, so they can more confidently decide to enter, exit, or hold a position.
---
2. Why a Trader Should Use It
• Unified View: Combines all essential market dimensions into one easy-to-read score and dashboard, eliminating the need to piece together signals manually.
• Adaptability: Automatically adjusts its internal weighting for trend, momentum, and price action based on current volatility. Whether markets are choppy or calm, the indicator remains relevant.
• Ease of Interpretation: Outputs a simple “BULLISH,” “BEARISH,” or “SIDEWAYS” label, supplemented by an intuitive on-chart dashboard and an oscillator plot that visually highlights market direction.
• Reliability Features: Built-in smoothing of the net score and hysteresis logic (requiring consecutive confirmations before flips) minimize false signals during noisy or range-bound phases.
---
3. Why These Specific Indicators?
This script relies on a curated set of well-established technical tools, each chosen for its particular strength in measuring one of the four core dimensions:
1. Trend Strength:
• ADX/DMI (Average Directional Index / Directional Movement Index): Measures how strong a trend is, and whether the +DI line is above the –DI line (bullish) or vice versa (bearish).
• Moving Average Slope (Fast MA vs. Slow MA): Compares a shorter-period SMA to a longer-period SMA; if the fast MA sits above the slow MA, it confirms an uptrend, and vice versa for a downtrend.
• Ichimoku Cloud Differential (Senkou A vs. Senkou B): Provides a forward-looking view of trend direction; Senkou A above Senkou B signals bullishness, and the opposite signals bearishness.
2. Momentum:
• Relative Strength Index (RSI): Identifies overbought (above its dynamically calculated upper bound) or oversold (below its lower bound) conditions; changes in RSI often precede price reversals.
• Stochastic %K: Highlights shifts in short-term momentum by comparing closing price to the recent high/low range; values above its upper band signal bullish momentum, below its lower band signal bearish momentum.
• MACD Histogram: Measures the difference between the MACD line and its signal line; a positive histogram indicates upward momentum, a negative histogram indicates downward momentum.
3. Price Action:
• Highest High / Lowest Low (HH/LL) Range: Over a defined lookback period, this captures breakout or breakdown levels. A closing price near the recent highs (with a positive MA slope) yields a bullish score, and near the lows (with a negative MA slope) yields a bearish score.
• Heikin-Ashi Doji Detection: Uses Heikin-Ashi candles to identify indecision or continuation patterns. A small Heikin-Ashi body (doji) relative to recent volatility is scored as neutral; a larger body in the direction of the MA slope is scored bullish or bearish.
• Candle Range Measurement: Compares each candle’s high-low range against its own dynamic band (average range ± standard deviation). Large candles aligning with the prevailing trend score bullish or bearish accordingly; unusually small candles can indicate exhaustion or consolidation.
4. Market Activity:
• Bollinger Bands Width (BBW): Measures the distance between BB upper and lower bands; wide bands indicate high volatility, narrow bands indicate low volatility.
• Average True Range (ATR): Quantifies average price movement (volatility). A sudden spike in ATR suggests a volatile environment, while a contraction suggests calm.
• Keltner Channels Width (KCW): Similar to BBW but uses ATR around an EMA. Provides a second layer of volatility context, confirming or contrasting BBW readings.
• Volume (with Moving Average): Compares current volume to its moving average ± standard deviation. High volume validates strong moves; low volume signals potential lack of conviction.
By combining these tools, the indicator captures trend direction, momentum strength, price-action nuances, and overall market energy, yielding a more balanced and comprehensive assessment than any single tool alone.
---
4. What Makes This Indicator Stand Out
• Multi-Dimensional Analysis: Rather than relying on a lone oscillator or moving average crossover, it simultaneously evaluates trend, momentum, price action, and activity.
• Dynamic Weighting: The relative importance of trend, momentum, and price action adjusts automatically based on real-time volatility (Market Activity State). For example, in highly volatile conditions, trend and momentum signals carry more weight; in calm markets, price action signals are prioritized.
• Stability Mechanisms:
• Smoothing: The net score is passed through a short moving average, filtering out noise, especially on lower timeframes.
• Hysteresis: Both Market Activity State and the final bullish/bearish/sideways zone require two consecutive confirmations before flipping, reducing whipsaw.
• Visual Interpretation: A fully customizable on-chart dashboard displays each sub-indicator’s value, regime, score, and comment, all color-coded. The oscillator plot changes color to reflect the current market zone (green for bullish, red for bearish, gray for sideways) and shows horizontal threshold lines at +2, 0, and –2.
---
5. Recommended Timeframes
• Short-Term (5 min, 15 min): Day traders and scalpers can benefit from rapid signals, but should enable smoothing (and possibly disable hysteresis) to reduce false whipsaws.
• Medium-Term (1 h, 4 h): Swing traders find a balance between responsiveness and reliability. Less smoothing is required here, and the default parameters (e.g., ADX length = 14, RSI length = 14) perform well.
• Long-Term (Daily, Weekly): Position traders tracking major trends can disable smoothing for immediate raw readings, since higher-timeframe noise is minimal. Adjust lookback lengths (e.g., increase adxLength, rsiLength) if desired for slower signals.
Tip: If you keep smoothing off, stick to timeframes of 1 h or higher to avoid excessive signal “chatter.”
---
6. How Scoring Works
A. Individual Indicator Scores
Each sub-indicator is assigned one of three discrete scores:
• +1 if it indicates a bullish condition (e.g., RSI above its dynamically calculated upper bound).
• 0 if it is neutral (e.g., RSI between upper and lower bounds).
• –1 if it indicates a bearish condition (e.g., RSI below its dynamically calculated lower bound).
Examples of individual score assignments:
• ADX/DMI:
• +1 if ADX ≥ adxThreshold and +DI > –DI (strong bullish trend)
• –1 if ADX ≥ adxThreshold and –DI > +DI (strong bearish trend)
• 0 if ADX < adxThreshold (trend strength below threshold)
• RSI:
• +1 if RSI > RSI_upperBound
• –1 if RSI < RSI_lowerBound
• 0 otherwise
• ATR (as part of Market Activity):
• +1 if ATR > (ATR_MA + stdev(ATR))
• –1 if ATR < (ATR_MA – stdev(ATR))
• 0 otherwise
Each of the four main categories shares this same +1/0/–1 logic across their sub-components.
B. Category Scores
Once each sub-indicator reports +1, 0, or –1, these are summed within their categories as follows:
• Trend Score = (ADX score) + (MA slope score) + (Ichimoku differential score)
• Momentum Score = (RSI score) + (Stochastic %K score) + (MACD histogram score)
• Price Action Score = (Highest-High/Lowest-Low score) + (Heikin-Ashi doji score) + (Candle range score)
• Market Activity Raw Score = (BBW score) + (ATR score) + (KC width score) + (Volume score)
Each category’s summed value can range between –3 and +3 (for Trend, Momentum, and Price Action), and between –4 and +4 for Market Activity raw.
C. Market Activity State and Dynamic Weight Adjustments
Rather than contributing directly to the netScore like the other three categories, Market Activity determines how much weight to assign to Trend, Momentum, and Price Action:
1. Compute Market Activity Raw Score by summing BBW, ATR, KCW, and Volume individual scores (each +1/0/–1).
2. Bucket into High, Medium, or Low Activity:
• High if raw Score ≥ 2 (volatile market).
• Low if raw Score ≤ –2 (calm market).
• Medium otherwise.
3. Apply Hysteresis (if enabled): The state only flips after two consecutive bars register the same high/low/medium label.
4. Set Category Weights:
• High Activity: Trend = 50 %, Momentum = 35 %, Price Action = 15 %.
• Low Activity: Trend = 25 %, Momentum = 20 %, Price Action = 55 %.
• Medium Activity: Use the trader’s base weight inputs (e.g., Trend = 40 %, Momentum = 30 %, Price Action = 30 % by default).
D. Calculating the Net Score
5. Normalize Base Weights (so that the sum of Trend + Momentum + Price Action always equals 100 %).
6. Determine Current Weights based on the Market Activity State (High/Medium/Low).
7. Compute Each Category’s Contribution: Multiply (categoryScore) × (currentWeight).
8. Sum Contributions to get the raw netScore (a floating-point value that can exceed ±3 when scores are strong).
9. Smooth the netScore over two bars (if smoothing is enabled) to reduce noise.
10. Apply Hysteresis to the Final Zone:
• If the smoothed netScore ≥ +2, the bar is classified as “Bullish.”
• If the smoothed netScore ≤ –2, the bar is classified as “Bearish.”
• Otherwise, it is “Sideways.”
• To prevent rapid flips, the script requires two consecutive bars in the new zone before officially changing the displayed zone (if hysteresis is on).
E. Thresholds for Zone Classification
• BULLISH: netScore ≥ +2
• BEARISH: netScore ≤ –2
• SIDEWAYS: –2 < netScore < +2
---
7. Role of Volatility (Market Activity State) in Scoring
Volatility acts as a dynamic switch that shifts which category carries the most influence:
1. High Activity (Volatile):
• Detected when at least two sub-scores out of BBW, ATR, KCW, and Volume equal +1.
• The script sets Trend weight = 50 % and Momentum weight = 35 %. Price Action weight is minimized at 15 %.
• Rationale: In volatile markets, strong trending moves and momentum surges dominate, so those signals are more reliable than nuanced candle patterns.
2. Low Activity (Calm):
• Detected when at least two sub-scores out of BBW, ATR, KCW, and Volume equal –1.
• The script sets Price Action weight = 55 %, Trend = 25 %, and Momentum = 20 %.
• Rationale: In quiet, sideways markets, subtle price-action signals (breakouts, doji patterns, small-range candles) are often the best early indicators of a new move.
3. Medium Activity (Balanced):
• Raw Score between –1 and +1 from the four volatility metrics.
• Uses whatever base weights the trader has specified (e.g., Trend = 40 %, Momentum = 30 %, Price Action = 30 %).
Because volatility can fluctuate rapidly, the script employs hysteresis on Market Activity State: a new High or Low state must occur on two consecutive bars before weights actually shift. This avoids constant back-and-forth weight changes and provides more stability.
---
8. Scoring Example (Hypothetical Scenario)
• Symbol: Bitcoin on a 1-hour chart.
• Market Activity: Raw volatility sub-scores show BBW (+1), ATR (+1), KCW (0), Volume (+1) → Total raw Score = +3 → High Activity.
• Weights Selected: Trend = 50 %, Momentum = 35 %, Price Action = 15 %.
• Trend Signals:
• ADX strong and +DI > –DI → +1
• Fast MA above Slow MA → +1
• Ichimoku Senkou A > Senkou B → +1
→ Trend Score = +3
• Momentum Signals:
• RSI above upper bound → +1
• MACD histogram positive → +1
• Stochastic %K within neutral zone → 0
→ Momentum Score = +2
• Price Action Signals:
• Highest High/Lowest Low check yields 0 (close not near extremes)
• Heikin-Ashi doji reading is neutral → 0
• Candle range slightly above upper bound but trend is strong, so → +1
→ Price Action Score = +1
• Compute Net Score (before smoothing):
• Trend contribution = 3 × 0.50 = 1.50
• Momentum contribution = 2 × 0.35 = 0.70
• Price Action contribution = 1 × 0.15 = 0.15
• Raw netScore = 1.50 + 0.70 + 0.15 = 2.35
• Since 2.35 ≥ +2 and hysteresis is met, the final zone is “Bullish.”
Although the netScore lands at 2.35 (Bullish), smoothing might bring it slightly below 2.00 on the first bar (e.g., 1.90), in which case the script would wait for a second consecutive reading above +2 before officially classifying the zone as Bullish (if hysteresis is enabled).
---
9. Correlation Between Categories
The four categories—Trend Strength, Momentum, Price Action, and Market Activity—often reinforce or offset one another. The script takes advantage of these natural correlations:
• Bullish Alignment: If ADX is strong and pointed upward, fast MA is above slow MA, and Ichimoku is positive, that usually coincides with RSI climbing above its upper bound and the MACD histogram turning positive. In such cases, both Trend and Momentum categories generate +1 or +2. Because the Market Activity State is likely High (given the accompanying volatility), Trend and Momentum weights are at their peak, so the netScore quickly crosses into Bullish territory.
• Sideways/Consolidation: During a low-volatility, sideways phase, ADX may fall below its threshold, MAs may flatten, and RSI might hover in the neutral band. However, subtle price-action signals (like a small breakout candle or a Heikin-Ashi candle with a slight bias) can still produce a +1 in the Price Action category. If Market Activity is Low, Price Action’s weight (55 %) can carry enough influence—even if Trend and Momentum are neutral—to push the netScore out of “Sideways” into a mild bullish or bearish bias.
• Opposing Signals: When Trend is bullish but Momentum turns negative (for example, price continues up but RSI rolls over), the two scores can partially cancel. Market Activity may remain Medium, in which case the netScore lingers near zero (Sideways). The trader can then wait for either a clearer momentum shift or a fresh price-action breakout before committing.
By dynamically recognizing these correlations and adjusting weights, the indicator ensures that:
• When Trend and Momentum align (and volatility supports it), the netScore leaps strongly into Bullish or Bearish.
• When Trend is neutral but Price Action shows an early move in a low-volatility environment, Price Action’s extra weight in the Low Activity State can still produce actionable signals.
---
10. Market Activity State & Its Role (Detailed)
The Market Activity State is not a direct category score—it is an overarching context setter for how heavily to trust Trend, Momentum, or Price Action. Here’s how it is derived and applied:
1. Calculate Four Volatility Sub-Scores:
• BBW: Compare the current band width to its own moving average ± standard deviation. If BBW > (BBW_MA + stdev), assign +1 (high volatility); if BBW < (BBW_MA × 0.5), assign –1 (low volatility); else 0.
• ATR: Compare ATR to its moving average ± standard deviation. A spike above the upper threshold is +1; a contraction below the lower threshold is –1; otherwise 0.
• KCW: Same logic as ATR but around the KCW mean.
• Volume: Compare current volume to its volume MA ± standard deviation. Above the upper threshold is +1; below the lower threshold is –1; else 0.
2. Sum Sub-Scores → Raw Market Activity Score: Range between –4 and +4.
3. Assign Market Activity State:
• High Activity: Raw Score ≥ +2 (at least two volatility metrics are strongly spiking).
• Low Activity: Raw Score ≤ –2 (at least two metrics signal unusually low volatility or thin volume).
• Medium Activity: Raw Score is between –1 and +1 inclusive.
4. Hysteresis for Stability:
• If hysteresis is enabled, a new state only takes hold after two consecutive bars confirm the same High, Medium, or Low label.
• This prevents the Market Activity State from bouncing around when volatility is on the fence.
5. Set Category Weights Based on Activity State:
• High Activity: Trend = 50 %, Momentum = 35 %, Price Action = 15 %.
• Low Activity: Trend = 25 %, Momentum = 20 %, Price Action = 55 %.
• Medium Activity: Use trader’s base weights (e.g., Trend = 40 %, Momentum = 30 %, Price Action = 30 %).
6. Impact on netScore: Because category scores (–3 to +3) multiply by these weights, High Activity amplifies the effect of strong Trend and Momentum scores; Low Activity amplifies the effect of Price Action.
7. Market Context Tooltip: The dashboard includes a tooltip summarizing the current state—e.g., “High activity, trend and momentum prioritized,” “Low activity, price action prioritized,” or “Balanced market, all categories considered.”
---
11. Category Weights: Base vs. Dynamic
Traders begin by specifying base weights for Trend Strength, Momentum, and Price Action that sum to 100 %. These apply only when volatility is in the Medium band. Once volatility shifts:
• High Volatility Overrides:
• Trend jumps from its base (e.g., 40 %) to 50 %.
• Momentum jumps from its base (e.g., 30 %) to 35 %.
• Price Action is reduced to 15 %.
Example: If base weights were Trend = 40 %, Momentum = 30 %, Price Action = 30 %, then in High Activity they become 50/35/15. A Trend score of +3 now contributes 3 × 0.50 = +1.50 to netScore; a Momentum +2 contributes 2 × 0.35 = +0.70. In total, Trend + Momentum can easily push netScore above the +2 threshold on its own.
• Low Volatility Overrides:
• Price Action leaps from its base (30 %) to 55 %.
• Trend falls to 25 %, Momentum falls to 20 %.
Why? When markets are quiet, subtle candle breakouts, doji patterns, and small-range expansions tend to foreshadow the next swing more effectively than raw trend readings. A Price Action score of +3 in this state contributes 3 × 0.55 = +1.65, which can carry the netScore toward +2—even if Trend and Momentum are neutral or only mildly positive.
Because these weight shifts happen only after two consecutive bars confirm a High or Low state (if hysteresis is on), the indicator avoids constantly flipping its emphasis during borderline volatility phases.
---
12. Dominant Category Explained
Within the dashboard, a label such as “Trend Dominant,” “Momentum Dominant,” or “Price Action Dominant” appears when one category’s absolute weighted contribution to netScore is the largest. Concretely:
• Compute each category’s weighted contribution = (raw category score) × (current weight).
• Compare the absolute values of those three contributions.
• The category with the highest absolute value is flagged as Dominant for that bar.
Why It Matters:
• Momentum Dominant: Indicates that the combined force of RSI, Stochastic, and MACD (after weighting) is pushing netScore farther than either Trend or Price Action. In practice, it means that short-term sentiment and speed of change are the primary drivers right now, so traders should watch for continued momentum signals before committing to a trade.
• Trend Dominant: Means ADX, MA slope, and Ichimoku (once weighted) outweigh the other categories. This suggests a strong directional move is in place; trend-following entries or confirming pullbacks are likely to succeed.
• Price Action Dominant: Occurs when breakout/breakdown patterns, Heikin-Ashi candle readings, and range expansions (after weighting) are the most influential. This often happens in calmer markets, where subtle shifts in candle structure can foreshadow bigger moves.
By explicitly calling out which category is carrying the most weight at any moment, the dashboard gives traders immediate insight into why the netScore is tilting toward bullish, bearish, or sideways.
---
13. Oscillator Plot: How to Read It
The “Net Score” oscillator sits below the dashboard and visually displays the smoothed netScore as a line graph. Key features:
1. Value Range: In normal conditions it oscillates roughly between –3 and +3, but extreme confluences can push it outside that range.
2. Horizontal Threshold Lines:
• +2 Line (Bullish threshold)
• 0 Line (Neutral midline)
• –2 Line (Bearish threshold)
3. Zone Coloring:
• Green Background (Bullish Zone): When netScore ≥ +2.
• Red Background (Bearish Zone): When netScore ≤ –2.
• Gray Background (Sideways Zone): When –2 < netScore < +2.
4. Dynamic Line Color:
• The plotted netScore line itself is colored green in a Bullish Zone, red in a Bearish Zone, or gray in a Sideways Zone, creating an immediate visual cue.
Interpretation Tips:
• Crossing Above +2: Signals a strong enough combined trend/momentum/price-action reading to classify as Bullish. Many traders wait for a clear crossing plus a confirmation candle before entering a long position.
• Crossing Below –2: Indicates a strong Bearish signal. Traders may consider short or exit strategies.
• Rising Slope, Even Below +2: If netScore climbs steadily from neutral toward +2, it demonstrates building bullish momentum.
• Divergence: If price makes a higher high but the oscillator fails to reach a new high, it can warn of weakening momentum and a potential reversal.
---
14. Comments and Their Necessity
Every sub-indicator (ADX, MA slope, Ichimoku, RSI, Stochastic, MACD, HH/LL, Heikin-Ashi, Candle Range, BBW, ATR, KCW, Volume) generates a short comment that appears in the detailed dashboard. Examples:
• “Strong bullish trend” or “Strong bearish trend” for ADX/DMI
• “Fast MA above slow MA” or “Fast MA below slow MA” for MA slope
• “RSI above dynamic threshold” or “RSI below dynamic threshold” for RSI
• “MACD histogram positive” or “MACD histogram negative” for MACD Hist
• “Price near highs” or “Price near lows” for HH/LL checks
• “Bullish Heikin Ashi” or “Bearish Heikin Ashi” for HA Doji scoring
• “Large range, trend confirmed” or “Small range, trend contradicted” for Candle Range
Additionally, the top-row comment for each category is:
• Trend: “Highly Bullish,” “Highly Bearish,” or “Neutral Trend.”
• Momentum: “Strong Momentum,” “Weak Momentum,” or “Neutral Momentum.”
• Price Action: “Bullish Action,” “Bearish Action,” or “Neutral Action.”
• Market Activity: “Volatile Market,” “Calm Market,” or “Stable Market.”
Reasons for These Comments:
• Transparency: Shows exactly how each sub-indicator contributed to its category score.
• Education: Helps traders learn why a category is labeled bullish, bearish, or neutral, building intuition over time.
• Customization: If, for example, the RSI comment says “RSI neutral” despite an impending trend shift, a trader might choose to adjust RSI length or thresholds.
In the detailed dashboard, hovering over each comment cell also reveals a tooltip with additional context (e.g., “Fast MA above slow MA” or “Senkou A above Senkou B”), helping traders understand the precise rule behind that +1, 0, or –1 assignment.
---
15. Real-Life Example (Consolidated)
• Instrument & Timeframe: Bitcoin (BTCUSD), 1-hour chart.
• Current Market Activity: BBW and ATR both spike (+1 each), KCW is moderately high (+1), but volume is only neutral (0) → Raw Market Activity Score = +2 → State = High Activity (after two bars, if hysteresis is on).
• Category Weights Applied: Trend = 50 %, Momentum = 35 %, Price Action = 15 %.
• Trend Sub-Scores:
1. ADX = 25 (above threshold 20) with +DI > –DI → +1.
2. Fast MA (20-period) sits above Slow MA (50-period) → +1.
3. Ichimoku: Senkou A > Senkou B → +1.
→ Trend Score = +3.
• Momentum Sub-Scores:
4. RSI = 75 (above its moving average +1 stdev) → +1.
5. MACD histogram = +0.15 → +1.
6. Stochastic %K = 50 (mid-range) → 0.
→ Momentum Score = +2.
• Price Action Sub-Scores:
7. Price is not within 1 % of the 20-period high/low and slope = positive → 0.
8. Heikin-Ashi body is slightly larger than stdev over last 5 bars with haClose > haOpen → +1.
9. Candle range is just above its dynamic upper bound but trend is already captured, so → +1.
→ Price Action Score = +2.
• Calculate netScore (before smoothing):
• Trend contribution = 3 × 0.50 = 1.50
• Momentum contribution = 2 × 0.35 = 0.70
• Price Action contribution = 2 × 0.15 = 0.30
• Raw netScore = 1.50 + 0.70 + 0.30 = 2.50 → Immediately classified as Bullish.
• Oscillator & Dashboard Output:
• The oscillator line crosses above +2 and turns green.
• Dashboard displays:
• Trend Regime “BULLISH,” Trend Score = 3, Comment = “Highly Bullish.”
• Momentum Regime “BULLISH,” Momentum Score = 2, Comment = “Strong Momentum.”
• Price Action Regime “BULLISH,” Price Action Score = 2, Comment = “Bullish Action.”
• Market Activity State “High,” Comment = “Volatile Market.”
• Weights: Trend 50 %, Momentum 35 %, Price Action 15 %.
• Dominant Category: Trend (because 1.50 > 0.70 > 0.30).
• Overall Score: 2.50, posCount = (three +1s in Trend) + (two +1s in Momentum) + (two +1s in Price Action) = 7 bullish signals, negCount = 0.
• Final Zone = “BULLISH.”
• The trader sees that both Trend and Momentum are reinforcing each other under high volatility. They might wait one more candle for confirmation but already have strong evidence to consider a long.
---
• .
---
Disclaimer
This indicator is strictly a technical analysis tool and does not constitute financial advice. All trading involves risk, including potential loss of capital. Past performance is not indicative of future results. Traders should:
• Always backtest the “Market Zone Analyzer ” on their chosen symbols and timeframes before committing real capital.
• Combine this tool with sound risk management, position sizing, and, if possible, fundamental analysis.
• Understand that no indicator is foolproof; always be prepared for unexpected market moves.
Goodluck
-BullByte!
---

CCI Divergence Detector
A technical analysis tool that identifies divergences between price action and the Commodity Channel Index (CCI) oscillator. Unlike standard divergence indicators, this system employs advanced gradient visualization, multi-layer wave effects, and comprehensive customization options to provide traders with crystal-clear divergence signals and market momentum insights.
Core Detection Mechanism
CCI-Based Analysis: The indicator utilizes the Commodity Channel Index as its primary oscillator, calculated from user-configurable source data (default: HLC3) with adjustable length parameters. The CCI provides reliable momentum readings that effectively highlight price-momentum divergences.
Dynamic Pivot Detection: The system employs adaptive pivot detection with three sensitivity levels (High/Normal/Low) to identify significant highs and lows in both price and CCI values. This dynamic approach ensures optimal divergence detection across different market conditions and timeframes.
Dual Divergence Analysis:
Regular Bullish Divergences: Detected when price makes lower lows while CCI makes higher lows, indicating potential upward reversal
Regular Bearish Divergences: Identified when price makes higher highs while CCI makes lower highs, signaling potential downward reversal
Strength Classification System: Each detected divergence is automatically classified into three strength categories (Weak/Moderate/Strong) based on:
-Price differential magnitude
-CCI differential magnitude
-Time duration between pivot points
-User-configurable strength multiplier
Advanced Visual System
Multi-Layer Wave Effects: The indicator features a revolutionary wave visualization system that creates depth through multiple gradient layers around the CCI line. The wave width dynamically adjusts based on ATR volatility, providing intuitive visual feedback about market conditions.
Professional Color Gradient System: Nine independent color inputs control every visual aspect:
Bullish Colors (Light/Medium/Dark): Control oversold areas, wave effects, and strong bullish signals
Bearish Colors (Light/Medium/Dark): Manage overbought zones, wave fills, and strong bearish signals
Neutral Colors (Light/Medium/Dark): Handle table elements, zero line, and transitional states
Intelligent Color Mapping: Colors automatically adapt based on CCI values:
Overbought territory (>100): Bearish color gradients with increasing intensity
Neutral positive (0 to 100): Blend from neutral to bearish tones
Oversold territory (<-100): Bullish color gradients with increasing intensity
Neutral negative (-100 to 0): Transition from neutral to bullish tones
Key Features & Components
Advanced Configuration System: Eight organized input groups provide granular control:
General Settings: System enable, pivot length, confidence thresholds
Oscillator Selection: CCI parameters, overbought/oversold levels, normalization options
Detection Parameters: Divergence types, minimum strength requirements
Sensitivity Tuning: Pivot sensitivity, divergence threshold, confirmation bars
Visual System: Line thickness, labels, backgrounds, table display
Wave Effects: Dynamic width, volatility response, layer count, glow effects
Transparency Controls: Independent transparency for all visual elements
Smoothing & Filtering: CCI smoothing types, noise filtering, wave smoothing
Professional Alert System: Comprehensive alert functionality with dynamic messages including:
-Divergence type and strength classification
-Current CCI value and confidence percentage
-Customizable alert frequency and conditions
Enhanced Information Table: Real-time display showing:
-Current CCI length and value
-Market status (Overbought/Normal/Oversold)
-Active sensitivity setting
Configurable table positioning (4 corner options)
Visual Elements Explained
Primary CCI Line: Main oscillator plot with gradient coloring that reflects market momentum and CCI intensity. Line thickness is user-configurable (1-8 pixels).
Wave Effect Layers: Multi-layer gradient fills creating a dynamic wave around the
CCI line:
-Outer layers provide broad market context
-Inner layers highlight immediate momentum
-Core layers show precise CCI movement
-All layers respond to volatility and momentum changes
Divergence Lines & Labels:
-Solid lines connecting divergence pivot points
-Color-coded based on divergence type and strength
-Labels displaying divergence type and strength classification
-Customizable transparency and size options
Reference Lines:
-Zero line with neutral color coding
-Overbought level (default: 100) with bearish coloring
-Oversold level (default: -100) with bullish coloring
Background Gradient: Optional background coloring that reflects CCI intensity and market conditions with user-controlled transparency (80-99%).
Configuration Options
Sensitivity Controls:
Pivot sensitivity: High/Normal/Low detection levels
Divergence threshold: 0.1-2.0 sensitivity range
Confirmation bars: 1-5 bar confirmation requirement
Strength multiplier: 0.1-3.0 calculation adjustment
Visual Customization:
Line transparency: 0-90% for main elements
Wave transparency: 0-95% for fill effects
Background transparency: 80-99% for subtle background
Label transparency: 0-50% for text elements
Glow transparency: 50-95% for glow effects
Advanced Processing:
Five smoothing types: None/SMA/EMA/RMA/WMA
Noise filtering with adjustable threshold (0.1-10.0)
CCI normalization for enhanced gradient scaling
Dynamic wave width with ATR-based volatility response
Interpretation Guidelines
Divergence Signals:
Strong divergences: High-confidence reversal signals requiring immediate attention
Moderate divergences: Reliable signals suitable for most trading strategies
Weak divergences: Early warning signals best combined with additional confirmation
Wave Intensity: Wave width and color intensity provide real-time volatility and momentum feedback. Wider, more intense waves indicate higher market volatility and stronger momentum.
Color Transitions: Smooth color transitions between bullish, neutral, and bearish states help identify market regime changes and momentum shifts.
CCI Levels: Traditional overbought (>100) and oversold (<-100) levels remain relevant, but the gradient system provides more nuanced momentum reading between these extremes.
Technical Specifications
Compatible Timeframes: All timeframes supported
Maximum Labels: 500 (for divergence marking)
Maximum Lines: 500 (for divergence drawing)
Pine Script Version: v5 (latest optimization)
Overlay Mode: False (separate pane indicator)
Usage Recommendations
This indicator works best when:
-Combined with price action analysis and support/resistance levels
-Used across multiple timeframes for confirmation
-Integrated with proper risk management protocols
-Applied in trending markets for divergence-based reversal signals
-Utilized with other technical indicators for comprehensive analysis
Risk Disclaimer: Trading involves substantial risk of loss. This indicator is provided for analytical purposes only and does not constitute financial advice. Divergence signals, while powerful, are not guaranteed to predict future price movements. Past performance is not indicative of future results. Always use proper risk management and never trade with capital you cannot afford to lose.

Volume Flow OscillatorVolume Flow Oscillator
Overview
The Volume Flow Oscillator is an advanced technical analysis tool that measures buying and selling pressure by combining price direction with volume. Unlike traditional volume indicators, this oscillator reveals the force behind price movements, helping traders identify strong trends, potential reversals, and divergences between price and volume.
Reading the Indicator
The oscillator displays seven colored bands that fluctuate around a zero line:
Three bands above zero (yellow) indicate increasing levels of buying pressure
Three bands below zero (red) indicate increasing levels of selling pressure
The central band represents the baseline volume flow
Color intensity changes based on whether values are positive or negative
Trading Signals
The Volume Flow Oscillator provides several valuable trading signals:
Zero-line crossovers: When multiple bands cross from negative to positive, potential bullish shift; opposite for bearish
Divergences: When price makes new highs/lows but oscillator bands fail to confirm, signals potential reversal
Volume climax: Extreme readings where outer bands stretch far from zero often precede reversals
Trend confirmation: Strong expansion of bands in direction of price movement confirms genuine momentum
Support/resistance: During trends, bands may remain largely on one side of zero, showing continued directional pressure
Customization
Adjust these key parameters to optimize the oscillator for your trading style:
Lookback Length: Controls overall sensitivity (shorter = more responsive, longer = smoother)
Multipliers: Adjust sensitivity spread between bands for different market conditions
ALMA Settings: Fine-tune how the indicator weights recent versus historical data
VWMA Toggle: Enable for additional smoothing in volatile markets
Best Practices
For optimal results, use this oscillator in conjunction with price action and other confirmation indicators. The multi-band approach helps distinguish between minor fluctuations and significant volume events that might signal important market turns.

Adaptive Momentum Oscillator [LuxAlgo]The Adaptive Momentum Oscillator tool allows traders to measure the current relative momentum over a given period using the maximum delta in price.
It features a histogram with gradient color, divergences, and an adaptive moving average that allows traders to clearly see the smoothed trend direction.
🔶 USAGE
This unbounded oscillator has positive momentum when values are above 0 and negative momentum when values are below 0. The adaptive moving average is used as a minimum lag smoothing tool over the momentum histogram.
🔹 Signal Line
There are two main uses for the signal line drawn on the chart above.
Momentum crosses above or below the signal line: acceleration in momentum.
Signal line crosses the 0 value: positive or negative momentum.
🔹 Data Length
On the chart above, we can compare different length sizes and how the tool values change, allowing traders to get a shorter or longer-term view of current market strength.
🔹 Smoothing Length
In the previous figure, we can compare how different Smoothing Length values affect the oscillator output.
🔹 Divergences
The divergence detector is disabled by default. Traders can enable it and adjust the divergence length from the settings panel.
As we can see in the chart above, by changing the length of the divergences, traders can fine-tune their detection, a small number will detect smaller divergences, and use a larger number for larger divergences.
🔶 SETTINGS
Data: Select data source, close price by default
Data Length: Select the length for data gathering
Smoothing Length: Select the length for data smoothing
Divergences: Enable/Disable divergences detection and length
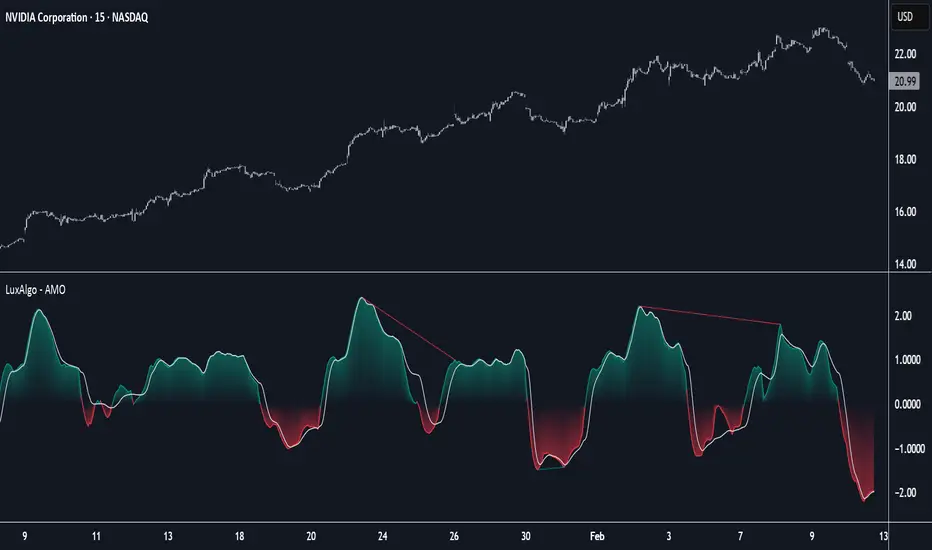
Quarterly Theory ICT 05 [TradingFinder] Doubling Theory Signals🔵 Introduction
Doubling Theory is an advanced approach to price action and market structure analysis that uniquely combines time-based analysis with key Smart Money concepts such as SMT (Smart Money Technique), SSMT (Sequential SMT), Liquidity Sweep, and the Quarterly Theory ICT.
By leveraging fractal time structures and precisely identifying liquidity zones, this method aims to reveal institutional activity specifically smart money entry and exit points hidden within price movements.
At its core, the market is divided into two structural phases: Doubling 1 and Doubling 2. Each phase contains four quarters (Q1 through Q4), which follow the logic of the Quarterly Theory: Accumulation, Manipulation (Judas Swing), Distribution, and Continuation/Reversal.
These segments are anchored by the True Open, allowing for precise alignment with cyclical market behavior and providing a deeper structural interpretation of price action.
During Doubling 1, a Sequential SMT (SSMT) Divergence typically forms between two correlated assets. This time-structured divergence occurs between two swing points positioned in separate quarters (e.g., Q1 and Q2), where one asset breaks a significant low or high, while the second asset fails to confirm it. This lack of confirmation—especially when aligned with the Manipulation and Accumulation phases—often signals early smart money involvement.
Following this, the highest and lowest price points from Doubling 1 are designated as liquidity zones. As the market transitions into Doubling 2, it commonly returns to these zones in a calculated move known as a Liquidity Sweep—a sharp, engineered spike intended to trigger stop orders and pending positions. This sweep, often orchestrated by institutional players, facilitates entry into large positions with minimal slippage.
Bullish :
Bearish :
🔵 How to Use
Applying Doubling Theory requires a simultaneous understanding of temporal structure and inter-asset behavioral divergence. The method unfolds over two main phases—Doubling 1 and Doubling 2—each divided into four quarters (Q1 to Q4).
The first phase focuses on identifying a Sequential SMT (SSMT) divergence, which forms when two correlated assets (e.g., EURUSD and GBPUSD, or NQ and ES) react differently to key price levels across distinct quarters. For example, one asset may break a previous low while the other maintains structure. This misalignment—especially in Q2, the Manipulation phase—often indicates early smart money accumulation or distribution.
Once this divergence is observed, the extreme highs and lows of Doubling 1 are marked as liquidity zones. In Doubling 2, the market gravitates back toward these zones, executing a Liquidity Sweep.
This move is deliberate—designed to activate clustered stop-loss and pending orders and to exploit pockets of resting liquidity. These sweeps are typically driven by institutional forces looking to absorb liquidity and position themselves ahead of the next major price move.
The key to execution lies in the fact that, during the sweep in Doubling 2, a classic SMT divergence should also appear between the two assets. This indicates a weakening of the previous trend and adds an extra layer of confirmation.
🟣 Bullish Doubling Theory
In the bullish scenario, Doubling 1 begins with a bullish SSMT divergence, where one asset forms a lower low while the other maintains its structure. This divergence signals weakening bearish momentum and possible smart money accumulation. In Doubling 2, the market returns to the previous low and sweeps the liquidity zone—breaking below it on one asset, while the second fails to confirm, forming a bullish SMT divergence.
f this move is followed by a bullish PSP and a clear market structure break (MSB), a long entry is triggered. The stop-loss is placed just below the swept liquidity zone, while the target is set in the premium zone, anticipating a move driven by institutional buyers.
🟣 Bearish Doubling Theory
The bearish scenario follows the same structure in reverse. In Doubling 1, a bearish SSMT divergence occurs when one asset prints a higher high while the other fails to do so. This suggests distribution and weakening buying pressure. Then, in Doubling 2, the market returns to the previous high and executes a liquidity sweep, targeting trapped buyers.
A bearish SMT divergence appears, confirming the move, followed by a bearish PSP on the lower timeframe. A short position is initiated after a confirmed MSB, with the stop-loss placed
🔵 Settings
⚙️ Logical Settings
Quarterly Cycles Type : Select the time segmentation method for SMT analysis.
Available modes include : Yearly, Monthly, Weekly, Daily, 90 Minute, and Micro.
These define how the indicator divides market time into Q1–Q4 cycles.
Symbol : Choose the secondary asset to compare with the main chart asset (e.g., XAUUSD, US100, GBPUSD).
Pivot Period : Sets the sensitivity of the pivot detection algorithm. A smaller value increases responsiveness to price swings.
Pivot Sync Threshold : The maximum allowed difference (in bars) between pivots of the two assets for them to be compared.
Validity Pivot Length : Defines the time window (in bars) during which a divergence remains valid before it's considered outdated.
🎨 Display Settings
Show Cycle :Toggles the visual display of the current Quarter (Q1 to Q4) based on the selected time segmentation
Show Cycle Label : Shows the name (e.g., "Q2") of each detected Quarter on the chart.
Show Labels : Displays dynamic labels (e.g., “Q2”, “Bullish SMT”, “Sweep”) at relevant points.
Show Lines : Draws connection lines between key pivot or divergence points.
Color Settings : Allows customization of colors for bullish and bearish elements (lines, labels, and shapes)
🔔 Alert Settings
Alert Name : Custom name for the alert messages (used in TradingView’s alert system).
Message Frequenc y:
All : Every signal triggers an alert.
Once Per Bar : Alerts once per bar regardless of how many signals occur.
Per Bar Close : Only triggers when the bar closes and the signal still exists.
Time Zone Display : Choose the time zone in which alert timestamps are displayed (e.g., UTC).
Bullish SMT Divergence Alert : Enable/disable alerts specifically for bullish signals.
Bearish SMT Divergence Alert : Enable/disable alerts specifically for bearish signals
🔵 Conclusion
Doubling Theory is a powerful and structured framework within the realm of Smart Money Concepts and ICT methodology, enabling traders to detect high-probability reversal points with precision. By integrating SSMT, SMT, Liquidity Sweeps, and the Quarterly Theory into a unified system, this approach shifts the focus from reactive trading to anticipatory analysis—anchored in time, structure, and liquidity.
What makes Doubling Theory stand out is its logical synergy of time cycles, behavioral divergence, liquidity targeting, and institutional confirmation. In both bullish and bearish scenarios, it provides clearly defined entry and exit strategies, allowing traders to engage the market with confidence, controlled risk, and deeper insight into the mechanics of price manipulation and smart money footprints.

Volumetric Tensegrity🧮 Volumetric Tensegrity unifies two of the Leading Indicator suite's critical engines — ZVOL ( volume anomaly detection ) and OBVX ( directional conviction ). Originally designed as a structural economizer for traders navigating strict indicator limits (e.g. < 10 slots per chart), it was forced to evolve beyond that constraint simply to fulfill it, albeit with a difference. The fatal flaw of traditional fusion, where two metrics are blended mathematically, is that they lose scale integrity (i.e. meaning). VTense encodes optical tensegrity to scale the amplitude of the ZVOL histogram and the slope of the OBVX spread independently, so that expansion and direction may coexist without either dominating the frame.
🧬 Tensegrity , by definition, is an intelligent design principle where elements in compression are suspended within a network of continuous tension, forming a stable, self-supporting structure . Originally conceived in esoteric biomorphology (c.f. Da Vinci, Snelson, Casteneda), tensegrity balances force through opposition, not rigidity. Applied to financial markets, Volumetric Tensegrity captures this same principle: price compresses, volume expands, conviction builds or fades — yet structure holds through the interplay. The result is not a prediction engine, but a pressure field — one that visualizes where structure might bend, break, or rebound based on how volume breathes.
🗜️ Rather than layering multiple indicators and consuming precious chart space, VTense frees up room for complementary overlays like momentum mapping, liquidity tiers, or volatility phase detection — making it ideal for modular traders operating in tight technical real estate.
🧠 Core Logic - VTense separates and preserves two essential structural forces:
• ZVOL Histogram : A Z-score-based expansion map that measures current volume deviation from its historical average. It reveals buildup zones, dormant stretches, and breakout pressure — regardless of price behavior.
• OBVX Spread : A directional conviction curve that tracks the difference between On-Balance Volume and its volume-weighted fast trend. It shows whether the crowd is leaning in (accumulation/distribution) or backing off.
🔊 ZVOL controls the amplitude of the histogram, while OBVX controls the curvature and slope of the spread. Without sacrificing breathing behavior or analytical depth, VTense provides a compact yet dynamic lens to track both expansion pressure and directional bias within a single footprint.
🌊 Volumetric Tensegrity forecasts breakout readiness, trend fatigue, and compression zones by measuring the volatility within volume . Unlike traditional tools that track volatility of price, this indicator reveals when effort becomes unstable — signaling inflection points before price reacts. Designed to decode rhythm shifts at the volume level, it operates as a pre-ignition scanner that thrives on low-timeframe charts (15m and under) while scaling effectively to 1H for validation.
🪖 From Generals to Scouts
👀 When used jointly, ZVOL + OBVX act as the general : deep-field analysts confirming stress, commitment, or exhaustion. VTense , by contrast, functions as a scout — capturing subtle buildup and alignment before structure fully reveals itself. The indicator aims to be a literal vanguard, establishing a position that can be confirmed or flexibly abandoned when the higher authority arrives to evaluate.
🥂 Use the ZVOL + OBVX pair when :
• You need independent axis control and manual dissection
• You’re building long-form confluence setups
• You have more indicator slots than you need
🔎 Use VTense when :
• You need compact clarity across multiple instruments
• You’re prioritizing confluence _detection_ over granular separation
• You’re building efficient multi-layered systems under slot constraints
🏗️ Structural Behavior and Interpretation
🫁 Z VOL Respiration Histogram : Structural Effort vs Baseline
🔵 Compression Coil – volume volatility is low and stable; the market is coiling
🟢 Steady Rhythm – volume is healthy but unremarkable; balanced participation
🟡 Passive/Absorbed Effort – expansion failing to manifest; watch for reversal
🟠 Clean Expansion – actionable volatility rise backed by structure
🔴 Volatile Blowout – chaos, climax; likely end-phase or fakeout
⚖️ ZVOL Respiration measures how hard the crowd is pressing — not just that volume is rising, but how statistically abnormal the surge is. Because it is rescaled proportionally to OBVX, the amplitude of the histogram reflects structural urgency without overwhelming the visual field.
🖐️ OBVX Spread : Real-Time Directional Conviction Behind Price Moves
🔑 The curvature of the spread reveals not just directional bias but crowd temp o: sharp slopes = urgent transitions; gradual slopes = building structural shifts. Curvature is key: sharp OBVX slope = urgency; gentle arcs = controlled drift or indecision.
• Green Rising : Accumulation — upward pressure from real buyers
• Red Falling : Distribution — sell pressure, downward slope
• Flat Curves : Transitional → uncertainty, microstructure digestion
🎭 Synchronized vs Divergent Behavior
⏱️ Synchronized (high-confluence) : often precedes structural breakouts, with internal conviction clearly visible before price resolves.
• ZVOL expands (yellow/orange/red) and OBVX climbs steeply green = strong bullish pressure
• ZVOL expands while OBVX steepens red = growing sell-side intent
🪤 Divergent (conflict tension) : flags potential traps, fakeouts, and liquidity sweeps.
• ZVOL expands sharply, but OBVX flattens or opposes → reactive expansion without crowd commitment
⛔️ Latent Drift + Structural Holding Patterns : tensegrity in action — the market holds tension without directional release.
• ZVOL compresses (blue) + OBVX meanders near zero → structure is resting, building up energy
• After prolonged drift, expect violent asymmetry when balance finally breaks
📚 Phase Interpretation: Dynamic Structural Read
• 1️⃣ Quiet Coil : Histogram flat, OBVX flat → no urgency
• 2️⃣ Initial Pulse : Yellow bars, OBVX slope builds → actionable tension
• 3️⃣ Structural Breath : Synchronized expansion and slope → directional commitment
• 4️⃣ Disagreement : Spike in ZVOL, flattening OBVX → exhaustion risk or false signal
💡 Suggested Use
• Run on 15m charts for breakout anticipation and 1H for validation
• Pair with ZVOL + OBVX to confirm crowd conviction behind the tension phase
• Use as a rhythm filter for the suite's trend indicators (e.g., RDI , SUPeR TReND 2.718 , et. al.)
• Ideal during low-volume regimes to detect pressure buildup before triggers
🧏🏻 Volumetric Tensegrity doesn’t signal. It breathes , and listens to pressure shifts before they speak in price. As a scout, it lets you see structural posture before signals align — helping you front-run resolution with clarity, not prediction.

RSI Divergence Strategy - AliferCryptoStrategy Overview
The RSI Divergence Strategy is designed to identify potential reversals by detecting regular bullish and bearish divergences between price action and the Relative Strength Index (RSI). It automatically enters positions when a divergence is confirmed and manages risk with configurable stop-loss and take-profit levels.
Key Features
Automatic Divergence Detection: Scans for RSI pivot lows/highs vs. price pivots using user-defined lookback windows and bar ranges.
Dual SL/TP Methods:
- Swing-based: Stops placed a configurable percentage beyond the most recent swing high/low.
- ATR-based: Stops placed at a multiple of Average True Range, with a separate risk/reward multiplier.
Long and Short Entries: Buys on bullish divergences; sells short on bearish divergences.
Fully Customizable: Input groups for RSI, divergence, swing, ATR, and general SL/TP settings.
Visual Plotting: Marks divergences on chart and plots stop-loss (red) and take-profit (green) lines for active trades.
Alerts: Built-in alert conditions for both bullish and bearish RSI divergences.
Detailed Logic
RSI Calculation: Computes RSI of chosen source over a specified period.
Pivot Detection:
- Identifies RSI pivot lows/highs by scanning a lookback window to the left and right.
- Uses ta.barssince to ensure pivots are separated by a minimum/maximum number of bars.
Divergence Confirmation:
- Bullish: Price makes a lower low while RSI makes a higher low.
- Bearish: Price makes a higher high while RSI makes a lower high.
Entry:
- Opens a Long position when bullish divergence is true.
- Opens a Short position when bearish divergence is true.
Stop-Loss & Take-Profit:
- Swing Method: Computes the recent swing high/low then adjusts by a percentage margin.
- ATR Method: Uses the current ATR × multiplier applied to the entry price.
- Take-Profit: Calculated as entry price ± (risk × R/R ratio).
Exit Orders: Uses strategy.exit to place bracket orders (stop + limit) for both long and short positions.
Inputs and Configuration
RSI Settings: Length & price source for the RSI.
Divergence Settings: Pivot lookback parameters and valid bar ranges.
SL/TP Settings: Choice between Swing or ATR method.
Swing Settings: Swing lookback length, margin (%), and risk/reward ratio.
ATR Settings: ATR length, stop multiplier, and risk/reward ratio.
Usage Notes
Adjust the Pivot Lookback and Range values to suit the volatility and timeframe of your market.
Use higher ATR multipliers for wider stops in choppy conditions, or tighten swing margins in trending markets.
Backtest different R/R ratios to find the balance between win rate and reward.
Disclaimer
This script is for educational purposes only and does not constitute financial advice. Trading carries significant risk and you may lose more than your initial investment. Always conduct your own research and consider consulting a professional before making any trading decisions.

Oath KeeperOath Keeper - Advanced Money Flow & Market Dynamics Indicator
A sophisticated indicator that analyzes market dynamics through money flow patterns, volume analysis, and liquidation detection to identify high-probability trading opportunities.
Core Features:
• Smart Money Flow Analysis: Proprietary calculation of institutional money movement
• Volume-Enhanced Signals: Multi-timeframe volume confirmation
• Liquidation Detection: Identifies potential forced liquidation events
• Advanced Signal Classification: Regular, Super, and Fakeout signals
Signal Types:
1. Regular Signals (Green/Purple Circles)
• Volume-confirmed momentum shifts
• Money flow threshold breaches
• Institutional participation confirmation
2. Super Signals (Green/Purple Squares)
• Deep oversold/overbought reversals
• High-volume rejection patterns
• Liquidation event confirmation
3. Fakeout Signals (Red X)
• Rapid sentiment shifts
• Trap detection
• False breakout warnings
Visual Components:
• Dynamic Money Flow Line (White/Purple)
• Order Flow Clouds (Green/Red with high transparency)
• Reference Levels (20, 50, 80)
• Multi-type Signal Markers
• Color-coded momentum visualization
Interpretation Guide:
• Green Cloud: Bullish money flow dominance
• Red Cloud: Bearish money flow dominance
• Circle Markers: Standard reversals
• Square Markers: High-conviction moves
• X Markers: Potential trap zones
Best Practices:
• Most effective on 1H+ timeframes
• Use with major trading pairs
• Wait for candle close confirmation
• Combine with support/resistance levels
• Monitor volume confirmation
• Use multiple timeframe analysis
This indicator helps traders identify institutional money flow, potential liquidation events, and market reversals by analyzing volume patterns and money flow dynamics, providing multiple confirmation layers for trade decisions.
Note: Performance varies with market conditions and timeframes. Always employ proper risk management.

ZVOL — Z-Score Volume Heatmapⓩ ZVOL transforms raw volume into a statistically calibrated heatmap using Z-score thresholds. Unlike classic volume indicators that rely on fixed MA comparisons, ZVOL calculates how many standard deviations each volume bar deviates from its mean. This makes the reading adaptive across timeframes and assets, in order to distinguish meaningful crowd behavior from random volatility.
📊 The core display is a five-zone histogram, each encoded by color and statistical depth. Optional background shading mirrors these zones across the entire pane, revealing subtle compression or structural rhythm shifts across time. By grounding the volume reading in volatility-adjusted context, ZVOL inhibits impulsive trading tactics by compelling the structure, not the sentiment, to dictate the signal.
🥵 Heatmap Coloration:
🌚 Suppressed volume — congestion, coiling phases
🩱 Stable flow — early trend or resting volume
🏀 High activity — emerging pressure
💔 Extreme — possible climax or institutional print
🎗️ A dynamic Fibonacci-based 21:34-period EMA ribbon overlays the histogram. The fill area inverts color on crossover, providing a real-time read on tempo, expansion, or divergence between price structure and crowd effort.
💡 LTF Usage Suggestions:
• Confirm breakout legs when orange or red zones align with range exits
• Fade overextended moves when red bars appear into resistance
• Watch for rising EMAs and orange volume to front-run impulsive moves
• Combine with volatility suppression (e.g. ATR) to catch compression → expansion transitions
🥂 Ideal Pairings:
• OBVX Conviction Bias — to confirm directional intent behind volume shifts
• SUPeR TReND 2.718 — for directional filters
• ATR Turbulence Ribbon — to detect compression phases
👥 The OBVX Conviction Bias adds a second dimension to ZVOL by revealing whether crowd effort is aligning with price direction or diverging beneath the surface. While ZVOL identifies statistical anomalies in raw volume, OBVX tracks directional commitment using cumulative volume and moving average cross logic. Use them together to spot fake-outs, anticipate structure-confirmed breakouts, or time pullbacks with volume-based conviction.
🔬 ZVOL isn’t just a volume filter — it’s a structural lens. It reveals when crowd effort is meaningful, when it's fading, and when something is about to shift. Designed for structure-aware traders who care about context, not noise.

SMT Divergence ICT 02 [TradingFinder] Smart Money Technique SMC🔵 Introduction
SMT Divergence (Smart Money Technique Divergence) is a price action-based trading concept that detects discrepancies in market behavior between two assets that are generally expected to move in the same direction. Rooted in ICT (Inner Circle Trader) methodology, this approach helps traders recognize subtle signs of market manipulation or imbalance, often ahead of traditional indicators.
The core idea behind SMT divergence is simple: when two correlated instruments—such as currency pairs, indices, or assets from the same sector—start forming different swing points (highs or lows), this can reveal a lack of confirmation in the trend. Such divergence is often a precursor to a price reversal or pause in momentum.
This technique works effectively across various markets including Forex, stocks, and cryptocurrencies. It’s particularly valuable when used alongside concepts like liquidity sweeps, market structure breaks (MSBs), or order block identification.
In advanced use cases, Sequential SMT helps uncover patterns of alternating divergences across sessions, often signaling engineered liquidity traps before price reacts.
When combined with the Quarterly Theory—which segments market behavior into Accumulation, Manipulation, Distribution, and Continuation/Reversal phases—traders gain insight not only into where divergence happens, but when it's most likely to be significant within the market cycle.
Bullish SMT :
Bullish SMT Divergence occurs when one asset prints a higher low while the correlated asset forms a lower low. This asymmetry often suggests that the downside move is losing strength, hinting at a potential bullish shift.
Bearish SMT :
Bearish SMT Divergence is formed when one asset creates a higher high, while the second asset fails to confirm by printing a lower high. This typically signals weakening bullish pressure and the possibility of a reversal to the downside.
🔵 How to Use
The SMT Divergence indicator is designed to detect imbalances between two positively correlated assets—such as major currency pairs, indices, or commodities. These divergences often indicate early signs of market inefficiency or smart money manipulation and can help traders anticipate trend shifts with higher precision.
Unlike traditional divergence indicators or earlier versions of this script, this upgraded version does not rely solely on consecutive pivot comparisons. Instead, it dynamically scans all available pivots within the chart to identify divergences at any structural level—major or minor—across the price action. This broader detection method increases the reliability and frequency of meaningful SMT signals.
Moreover, when integrated with Sequential SMT logic, the indicator is capable of identifying multiple divergence sequences across sessions. These sequences often signal engineered liquidity traps and can be mapped within the Quarterly Theory framework, allowing traders to pinpoint not just the presence of divergence but also the phase of the market cycle it appears in (Accumulation, Manipulation, Distribution, or Continuation).
🟣 Bullish SMT Divergence
This signal occurs when the primary asset forms a higher low, while the correlated asset forms a lower low. This pattern implies weakening bearish momentum and a potential shift to the upside.
If the correlated asset breaks its previous low but the primary asset does not, this divergence suggests absorption of selling pressure and possible accumulation by smart money—making it a strong bullish signal, especially when aligned with a favorable market phase (e.g., the end of a manipulation phase in Q2).
🟣 Bearish SMT Divergence
This signal occurs when the primary asset creates a higher high, while the correlated asset forms a lower high. This mismatch indicates fading bullish momentum and a potential reversal to the downside.
If the correlated asset fails to confirm a breakout made by the main asset, the divergence may point to distribution or exhaustion. When seen within Q3 or Q4 phases of the Quarterly Theory, this pattern often precedes sharp declines or fake-outs engineered by smart money
🔵 Settings
⚙️ Logical Settings
Symbol : Choose the secondary asset to compare with the main chart asset (e.g., XAUUSD, US100, GBPUSD).
Pivot Period : Sets the sensitivity of the pivot detection algorithm. A smaller value increases responsiveness to price swings.
Activate Max Pivot Back : When enabled, limits the maximum number of past pivots to be considered for divergence detection.
Max Pivot Back Length : Defines how many past pivots can be used (if the above toggle is active).
Pivot Sync Threshold : The maximum allowed difference (in bars) between pivots of the two assets for them to be compared.
Validity Pivot Length : Defines the time window (in bars) during which a divergence remains valid before it's considered outdated.
🎨 Display Settings
Show Bullish SMT Line : Draws a line connecting the bullish divergence points.
Show Bullish SMT Label : Displays a label on the chart when a bullish divergence is detected.
Bullish Color : Sets the color for bullish SMT markers (label, shape, and line).
Show Bearish SMT Line : Draws a line for bearish divergence.
Show Bearish SMT Label : Displays a label when a bearish SMT divergence is found.
Bearish Color : Sets the color for bearish SMT visual elements.
🔔 Alert Settings
Alert Name : Custom name for the alert messages (used in TradingView’s alert system).
Message Frequency :
All : Every signal triggers an alert.
Once Per Bar : Alerts once per bar regardless of how many signals occur.
Per Bar Close : Only triggers when the bar closes and the signal still exists.
Time Zone Display : Choose the time zone in which alert timestamps are displayed (e.g., UTC).
Bullish SMT Divergence Alert : Enable/disable alerts specifically for bullish signals.
Bearish SMT Divergence Alert : Enable/disable alerts specifically for bearish signals
🔵Conclusion
The SMT Plus indicator offers a refined and powerful approach to detecting smart money behavior through divergence analysis between correlated assets. By removing the limitations of consecutive pivot comparisons and allowing for broader structural detection, it captures more accurate and timely signals that often precede major market moves.
When paired with frameworks like Sequential SMT and the Quarterly Theory, the indicator not only highlights where divergence occurs, but also when in the market cycle it's most likely to matter. Its flexible settings, customizable visuals, and integrated alert system make it suitable for intraday scalpers, swing traders, and even long-term macro analysts.
Whether you're using it as a standalone decision-making tool or combining it with other ICT concepts, SMT Plus gives you an edge in recognizing manipulation, timing reversals, and staying in sync with the real market narrative—not just the chart.

Gioteen-NormThe "Gioteen-Norm" indicator is a versatile and powerful technical analysis tool designed to help traders identify key market conditions such as divergences, overbought/oversold levels, and trend strength. By normalizing price data relative to a moving average and standard deviation, this indicator provides a unique perspective on price behavior, making it easier to spot potential reversals or continuations in the market.
The indicator calculates a normalized value based on the difference between the selected price and its moving average, scaled by the standard deviation over a user-defined period. Additionally, an optional moving average of this normalized value (Green line) can be plotted to smooth the output and enhance signal clarity. This dual-line approach makes it an excellent tool for both short-term and long-term traders.
***Key Features
Divergence Detection: The Gioteen-Norm excels at identifying divergences between price action and the normalized indicator value. For example, if the price makes a higher high while Red line forms a lower high, it may signal a bearish divergence, hinting at a potential reversal.
Overbought/Oversold Conditions: Extreme values of Red line (e.g., significantly above or below zero) can indicate overbought or oversold conditions, helping traders anticipate pullbacks or bounces.
Trend Strength Insight: The normalized output reflects how far the price deviates from its average, providing a measure of momentum and trend strength.
**Customizable Parameters
Traders can adjust the period, moving average type, applied price, and shift to suit their trading style and timeframe.
**How It Works
Label1 (Red Line): Represents the normalized price deviation from a user-selected moving average (SMA, EMA, SMMA, or LWMA) divided by the standard deviation over the specified period. This line highlights the relative position of the price compared to its historical range.
Label2 (Green Line, Optional): A moving average of Label1, which smooths the normalized data to reduce noise and provide clearer signals. This can be toggled on or off via the "Draw MA" option.
**Inputs
Period: Length of the lookback period for normalization (default: 100).
MA Method: Type of moving average for normalization (SMA, EMA, SMMA, LWMA; default: EMA).
Applied Price: Price type used for calculation (Close, Open, High, Low, HL2, HLC3, HLCC4; default: Close).
Shift: Shifts the indicator forward or backward (default: 0).
Draw MA: Toggle the display of the Label2 moving average (default: true).
MA Period: Length of the moving average for Label2 (default: 50).
MA Method (Label2): Type of moving average for Label2 (SMA, EMA, SMMA, LWMA; default: SMA).
**How to Use
Divergence Trading: Look for discrepancies between price action and Label1. A bullish divergence (higher low in Label1 vs. lower low in price) may suggest a buying opportunity, while a bearish divergence could indicate a selling opportunity.
Overbought/Oversold Levels: Monitor extreme Label1 values. For instance, values significantly above +2 or below -2 could indicate overextension, though traders should define thresholds based on the asset and timeframe.
Trend Confirmation: Use Label2 to confirm trend direction. A rising Label2 suggests increasing bullish momentum, while a declining Label2 may indicate bearish pressure.
Combine with Other Tools: Pair Gioteen-Norm with support/resistance levels, RSI, or volume indicators for a more robust trading strategy.
**Notes
The indicator is non-overlay, meaning it plots below the price chart in a separate panel.
Avoid using a Period value of 1, as it may lead to unstable results due to insufficient data for standard deviation calculation.
This tool is best used as part of a broader trading system rather than in isolation.
**Why Use Gioteen-Norm?
The Gioteen-Norm indicator offers a fresh take on price normalization, blending statistical analysis with moving average techniques. Its flexibility and clarity make it suitable for traders of all levels—whether you're scalping on short timeframes or analyzing long-term trends. By publishing this for free, I hope to contribute to the TradingView community and help traders uncover hidden opportunities in the markets.
**Disclaimer
This indicator is provided for educational and informational purposes only. It does not constitute financial advice. Always backtest and validate any strategy before trading with real capital, and use proper risk management.

Larry Williams POIV A/D [tradeviZion]Larry Williams' POIV A/D - Release Notes v1.0
=================================================
Release Date: 01 April 2025
OVERVIEW
--------
The Larry Williams POIV A/D (Price, Open Interest, Volume Accumulation/Distribution) indicator implements Williams' original formula while adding advanced divergence detection capabilities. This powerful tool combines price movement, open interest, and volume data to identify potential trend reversals and continuations.
FEATURES
--------
- Implements Larry Williams' original POIV A/D formula
- Divergence detection system:
* Regular divergences for trend reversal signals
* Hidden divergences for trend continuation signals
- Fast Mode option for earlier pivot detection
- Customizable sensitivity for divergence filtering
- Dynamic color visualization based on indicator direction
- Adjustable smoothing to reduce noise
- Automatic fallback to OBV when Open Interest is unavailable
FORMULA
-------
POIV A/D = CumulativeSum(Open Interest * (Close - Close ) / (True High - True Low)) + OBV
Where:
- Open Interest: Current period's open interest
- Close - Close : Price change from previous period
- True High - True Low: True Range
- OBV: On Balance Volume
DIVERGENCE TYPES
---------------
1. Regular Divergences (Reversal Signals):
- Bullish: Price makes lower lows while indicator makes higher lows
- Bearish: Price makes higher highs while indicator makes lower highs
2. Hidden Divergences (Continuation Signals):
- Bullish: Price makes higher lows while indicator makes lower lows
- Bearish: Price makes lower highs while indicator makes higher highs
REQUIREMENTS
-----------
- Works best with futures and other instruments that provide Open Interest data
- Automatically adapts to work with any instrument by using OBV when OI is unavailable
USAGE GUIDE
-----------
1. Apply the indicator to any chart
2. Configure settings:
- Adjust sensitivity for divergence detection
- Enable/disable Fast Mode for earlier signals
- Customize visual settings as needed
3. Look for divergence signals:
- Regular divergences for potential trend reversals
- Hidden divergences for trend continuation opportunities
4. Use the alerts system for automated divergence detection
KNOWN LIMITATIONS
----------------
- Requires Open Interest data for full functionality
- Fast Mode may generate more signals but with lower reliability
ACKNOWLEDGEMENTS
---------------
This indicator is based on Larry Williams' work on Open Interest analysis. The implementation includes additional features for divergence detection while maintaining the integrity of the original formula.

Price action plus//The system combines the divergence of A/D and OBV with identifying reversal points using Japanese candlestick patterns, creating an enhanced version of price action. This helps investors more easily and accurately recognize reversal patterns in technical analysis.
Divergence of A/D vs. OBV includes:
Positive divergence: Identifies smart money leaving the market.
Negative divergence: Identifies smart money entering the market.
Reversal candlestick patterns include:
Buy signals: Morning Star, Bullish Engulfing, Hammer.
Strong Buy signals: Buy signals + Negative divergence
Sell signals: Evening Star, Bearish Engulfing, Shooting Star.
Strong Sell signals : Sell signals + Positive divergence
//Hope this system will be helpful for you!
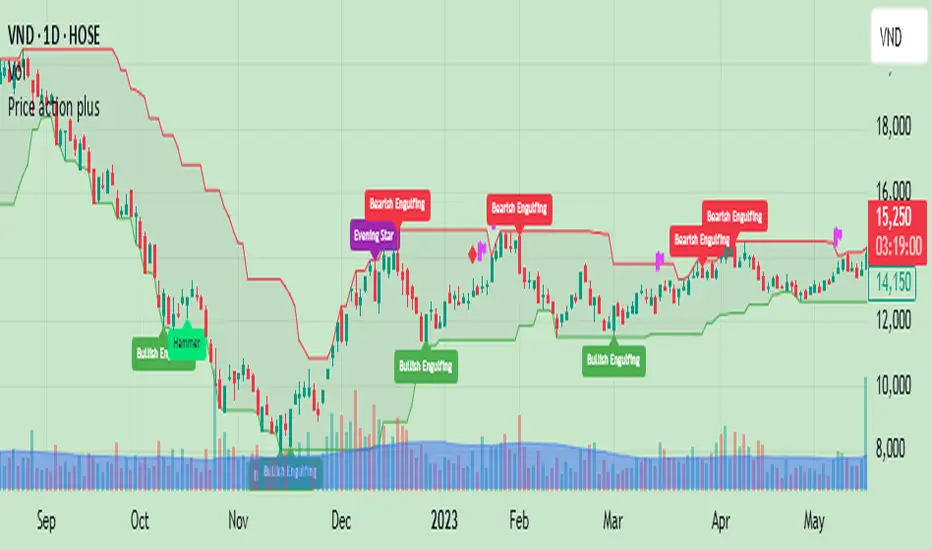
Momentum Volume Divergence (MVD) EnhancedMomentum Volume Divergence (MVD) Enhanced is a powerful indicator that detects price-momentum divergences and momentum suppression for reversal trading. Optimized for XRP on 1D charts, it features dynamic lookbacks, ATR-adjusted thresholds, and SMA confirmation. Signals include strong divergences (triangles) and suppression warnings (crosses). Includes a detailed user guide—try it out and share your feedback!
Setup: Add to XRP 1D chart with defaults (mom_length_base=8, vol_length_base=10). Signals: Red triangle (sell), Green triangle (buy), Orange cross (bear warning), Yellow cross (bull warning). Confirm with 5-day SMA crossovers. See full guide for details!
Disclaimer: This indicator is for educational purposes only, not financial advice. Trading involves risk—use at your discretion.
Momentum Volume Divergence (MVD) Enhanced Indicator User Guide
Version: Pine Script v6
Designed for: TradingView
Recommended Use: XRP on 1-day (1D) chart
Date: March 18, 2025
Author: Herschel with assistance from Grok 3 (xAI)
Overview
The Momentum Volume Divergence (MVD) Enhanced indicator is a powerful tool for identifying price-momentum divergences and momentum suppression patterns on XRP’s 1-day (1D) chart. Plotted below the price chart, it provides clear visual signals to help traders spot potential reversals and trend shifts.
Purpose
Detect divergences between price and momentum for buy/sell opportunities.
Highlight momentum suppression as warnings of fading trends.
Offer actionable trading signals with intuitive markers.
Indicator Components
Main Plot
Volume-Weighted Momentum (vw_mom): Blue line showing momentum adjusted by volume.
Above 0 = bullish momentum.
Below 0 = bearish momentum.
Zero Line: Gray dashed line at 0, separating bullish/bearish zones.
Key Signals
Strong Bearish Divergence:
Marker: Red triangle at the top.
Meaning: Price makes a higher high, but momentum weakens, confirmed by a drop below the 5-day SMA.
Action: Potential sell/short signal.
Strong Bullish Divergence:
Marker: Green triangle at the bottom.
Meaning: Price makes a lower low, but momentum strengthens, confirmed by a rise above the 5-day SMA.
Action: Potential buy/long signal.
Bearish Suppression:
Marker: Orange cross at the top + red background.
Meaning: Strong bullish momentum with low volume in a volume downtrend, suggesting fading strength.
Action: Warning to avoid longs or exit early.
Bullish Suppression:
Marker: Yellow cross at the bottom + green background.
Meaning: Strong bearish momentum with low volume in a volume uptrend, suggesting fading weakness.
Action: Warning to avoid shorts or exit early.
Debug Plots (Optional)
Volume Ratio: Gray line (volume vs. its MA) vs. yellow line (threshold).
Momentum Threshold: Purple lines (positive/negative momentum cutoffs).
Smoothed Momentum: Orange line (raw momentum).
Confirmation SMA: Purple line (price trend confirmation).
Labels
Text labels (e.g., "Bear Div," "Bull Supp") mark detected patterns.
How to Use the Indicator
Step-by-Step Trading Process
1. Monitor the Chart
Load your XRP 1D chart with the indicator applied.
Observe the blue vw_mom line and signal markers.
2. Spot a Signal
Primary Signals: Look for red triangles (strong_bear) or green triangles (strong_bull).
Warnings: Note orange crosses (suppression_bear) or yellow crosses (suppression_bull).
3. Confirm the Signal
For Strong Bullish Divergence (Buy):
Green triangle appears.
Price closes above the 5-day SMA (purple line) and a recent swing high.
Optional: Volume ratio (gray line) exceeds the threshold (yellow line).
For Strong Bearish Divergence (Sell):
Red triangle appears.
Price closes below the 5-day SMA and a recent swing low.
Optional: Volume ratio (gray line) falls below the threshold (yellow line).
4. Enter the Trade
Long:
Buy at the close of the signal bar.
Stop loss: Below the recent swing low or 2 × ATR(14) below entry.
Short:
Sell/short at the close of the signal bar.
Stop loss: Above the recent swing high or 2 × ATR(14) above entry.
5. Manage the Trade
Take Profit:
Aim for a 2:1 or 3:1 risk-reward ratio (e.g., risk $0.05, target $0.10-$0.15).
Or exit when an opposite suppression signal appears (e.g., orange cross for longs).
Trailing Stop:
Move stop to breakeven after a 1:1 RR move.
Trail using the 5-day SMA or 2 × ATR(14).
Early Exit:
Exit if a suppression signal appears against your position (e.g., suppression_bull while short).
6. Filter Out Noise
Avoid trades if a suppression signal precedes a divergence within 2-3 days.
Optional: Add a 50-day SMA on the price chart:
Longs only if price > 50-SMA.
Shorts only if price < 50-SMA.
Example Trades (XRP 1D)
Bullish Trade
Signal: Green triangle (strong_bull) at $0.55.
Confirmation: Price closes above 5-SMA and $0.57 high.
Entry: Buy at $0.58.
Stop Loss: $0.53 (recent low).
Take Profit: $0.63 (2:1 RR) or exit on suppression_bear.
Outcome: Price hits $0.64, exit at $0.63 for profit.
Bearish Trade
Signal: Red triangle (strong_bear) at $0.70.
Confirmation: Price closes below 5-SMA and $0.68 low.
Entry: Short at $0.67.
Stop Loss: $0.71 (recent high).
Take Profit: $0.62 (2:1 RR) or exit on suppression_bull.
Outcome: Price drops to $0.61, exit at $0.62 for profit.
Tips for Success
Combine with Price Levels:
Use support/resistance zones (e.g., weekly pivots) to confirm entries.
Monitor Volume:
Rising volume (gray line above yellow) strengthens signals.
Adjust Sensitivity:
Too many signals? Increase div_strength_threshold to 0.7.
Too few signals? Decrease to 0.3.
Backtest:
Review 20-30 past signals on XRP 1D to assess performance.
Avoid Choppy Markets:
Skip signals during low volatility (tight price ranges).
Troubleshooting
No Signals:
Lower div_strength_threshold to 0.3 or mom_threshold_base to 0.2.
Check if XRP’s volatility is unusually low.
False Signals:
Increase sma_confirm_length to 7 or add a 50-SMA filter.
Indicator Not Loading:
Ensure the script compiles without errors.
Customization (Optional)
Change Colors: Edit color.* values (e.g., color.red to color.purple).
Add Alerts: Use TradingView’s alert menu for "Strong Bearish Divergence Confirmed," etc.
Test Other Assets: Experiment with BTC or ETH, adjusting inputs as needed.
Disclaimer
This indicator is for educational purposes only and not financial advice. Trading involves risk, and past performance does not guarantee future results. Use at your own discretion.
Setup: Use on XRP 1D with defaults (mom_length_base=8, vol_length_base=10). Signals: Red triangle (sell), Green triangle (buy), Orange cross (bear warning), Yellow cross (bull warning). Confirm with 5-day SMA cross. Stop: 2x ATR(14). Profit: 2:1 RR or suppression exit. Full guide available separately!
