Crypto Gann Channel Strategy (Long Bias, fixed)This is Gann Strategy Cody with Long Bias. Please try and let me know if can be improved.
جان

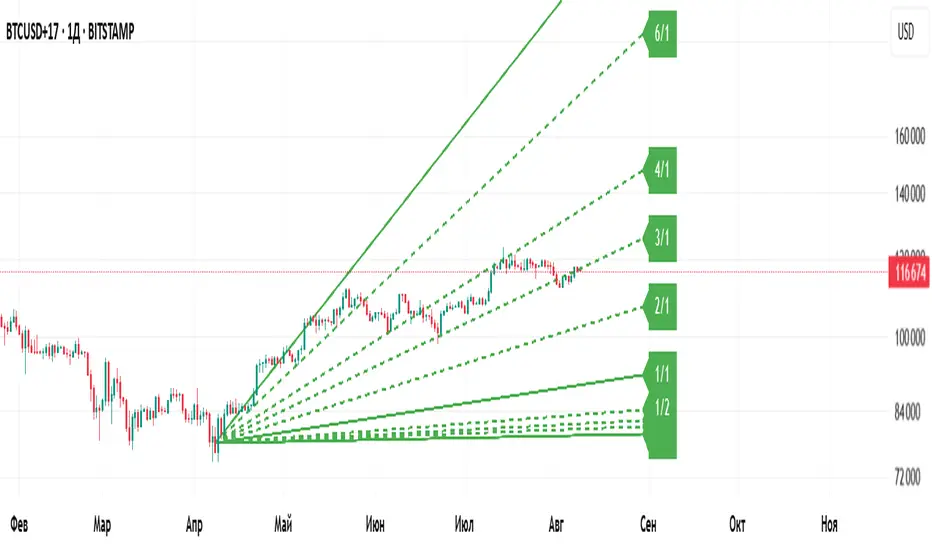
Gann Fan Master – Selectable Base Angle & Fibonacci AnglesGann Fan Master – Selectable Base Angle & Fibonacci Angles
This indicator plots a Gann Fan from point A1 through point B1, with full customization over:
Base angle selection (8/1, 1/1, 1/8)
Main angle set
Fibonacci-based angles
Up to 10 custom user-defined angles
Logarithmic or linear slope calculation
Custom fan color and extended line length
Perfect for manual chart analysis — you select A1 and B1, the script calculates and draws the fan with labeled angles.
How It Works
-Select A1 (time & price) and B1 (time & price).
-The script calculates the base slope depending on the selected base angle:
Linear scale: slope = (B1 − A1) / Δt / base_angle_value
Logarithmic scale: slope = (ln(B1) − ln(A1)) / Δt / base_angle_value
-Each enabled angle is drawn from A1, extended by the chosen number of bars, and labeled with its value.
-Fan color is determined automatically by direction (green for upward, red for downward) or can be overridden.
Quick Start
-Add the indicator to your chart.
-In settings:
A1 Time/Price — starting point.
B1 Time/Price — second point (defines slope).
Base Angle — choose 8/1, 1/1, or 1/8.
Extend Fan (Bars) — number of bars to extend lines into the future.
Logarithmic Fan Calculation — toggle for log-scale mode.
Enable desired angle sets: Main, Fibonacci, or Custom.
-Optionally, enable Use Custom Fan Color and set your own color.
Settings
Enable Fan — master switch.
A1 Time/A1 Price, B1 Time/B1 Price — anchor points.
Base Angle — 8/1, 1/1, 1/8.
Extend Fan (Bars) — extension length.
Use Custom Fan Color / Fan Color — manual color override.
Main Angles — 1/8, 1/4, 1/3, 1/2, 1/1, 2/1, 3/1, 4/1, 6/1, 8/1.
Fibonacci Angles — 0.214, 0.35, 0.382, 0.618, 0.786, 0.886, 0.9335, 1.118, 1.236, 1.382, 1.618.
Custom Angles — up to 10 values (dotted lines), labels from the exact value.
Usage Tips
-Choosing A1 and B1:
A1 — significant starting swing high or low.
B1 — next key swing to define slope.
-Logarithmic scale:
Ideal for long-term exponential trends (crypto, growth stocks).
Prices must be > 0.
-Watch how price reacts to different angles:
1/1 as median trend, fractional for support/resistance, multiples for acceleration/slowdown.
Disclaimer
This is a technical analysis tool. It is not financial advice. Trading decisions are made at your own risk.
Gann Fan Master – Selectable Base Angle & Fibonacci Angles
Индикатор строит веер Ганна от точки A1 через точку B1 с полной кастомизацией:
Выбор базового угла (8/1, 1/1, 1/8)
Набор основных углов
Углы Фибоначчи
До 10 пользовательских углов
Расчёт в логарифмической или линейной шкале
Цвет веера по направлению или заданный вручную
Настройка длины продления линий
Идеально подходит для ручного анализа графика — вы задаёте A1 и B1, а скрипт рассчитывает и строит веер с подписями углов.
Как это работает
-Задайте A1 (время и цена) и B1 (время и цена).
-Скрипт рассчитывает базовый наклон в зависимости от выбранного базового угла:
Линейная шкала: наклон = (B1 − A1) / Δt / base_angle_value
Логарифмическая шкала: наклон = (ln(B1) − ln(A1)) / Δt / base_angle_value
-Каждый включённый угол рисуется из точки A1, продлевается на заданное число баров и подписывается.
-Цвет линий определяется автоматически по направлению (зелёный — вверх, красный — вниз) или задаётся вручную.
Быстрый старт
1)Добавьте индикатор на график.
2)В настройках:
A1 Time/Price — начальная точка.
B1 Time/Price — вторая точка (задаёт наклон).
Base Angle — выберите 8/1, 1/1 или 1/8.
Extend Fan (Bars) — длина продления линий в барах.
Logarithmic Fan Calculation — переключатель логарифмического режима.
Включите нужные блоки углов: Main, Fibonacci, Custom.
3)При желании активируйте Use Custom Fan Color и задайте цвет веера.
Настройки
Enable Fan — общий выключатель.
A1 Time/A1 Price, B1 Time/B1 Price — опорные точки.
Base Angle — 8/1, 1/1, 1/8.
Extend Fan (Bars) — продление линий.
Use Custom Fan Color / Fan Color — цвет вручную.
Main Angles — 1/8, 1/4, 1/3, 1/2, 1/1, 2/1, 3/1, 4/1, 6/1, 8/1.
Fibonacci Angles — 0.214, 0.35, 0.382, 0.618, 0.786, 0.886, 0.9335, 1.118, 1.236, 1.382, 1.618.
Custom Angles — до 10 значений (точечные линии) с подписями.
Советы по применению
Выбор A1 и B1:
A1 — значимый экстремум начала движения.
B1 — следующий важный экстремум для задания наклона.
Логарифмическая шкала:
Подходит для долгосрочных экспоненциальных трендов (крипто, акции роста).
Цена должна быть > 0.
Следите, как цена реагирует на разные углы:
1/1 — медианный тренд.
Дробные углы — потенциальная поддержка/сопротивление.
Кратные — ускорение/замедление движения.
Дисклеймер
Это инструмент технического анализа и не является инвестиционной рекомендацией. Торговые решения вы принимаете на свой страх и риск.
Gann Single Square Swing Trading System with Gann AnglesGann Single Square Swing Trading System
This script automatically detects "squares" - geometric patterns where price movement equals time movement. When price moves the same distance as the number of bars (time), it creates powerful support/resistance levels based on Gann theory.
Key Visual Elements
• Box: The detected square pattern
• Dark Blue Line (50%): Most important trading level
• Green Lines: Profit target levels (125%, 150%)
• Red Lines: Stop loss levels (-25%, -50%)
• Colored Angle Lines: Gann angles for trend direction
• Quality Score: Blue label showing setup strength (aim for 70%+)
Simple Trading Rules
LONG Trades (Green 🟢 Square)
1. Entry: Buy when price touches the dark blue 50% line from above
2. Stop Loss: Place below the red -25% line
3. Take Profit: Exit at green 125% line (first target) or 150% line (second target)
SHORT Trades (Red 🔴 Square)
1. Entry: Sell when price touches the dark blue 50% line from below
2. Stop Loss: Place above the red -25% line
3. Take Profit: Exit at green 125% line (first target) or 150% line (second target)
Entry Checklist
✅ Square quality score > 70%
✅ Price touches 50% level (dark blue line)
✅ Volume above average (if volume filter enabled)
✅ Clear square formation visible
Alerts
The script generates automatic alerts when price reaches the 50% trading level. Enable alerts in TradingView to get notified of setups.
Bottom Line: Wait for the alert → Check quality score → Enter at 50% level → Set stop at red line → Take profit at green line.

Angled Gann Time-Price Squares with S/RThis is a Pine Script indicator that implements Angled Gann Time-Price Squares based on W.D. Gann's trading theory. Here's what it does:
Core Functionality
Detects pivot highs and lows using a configurable lookback period
Creates angled squares by connecting pivot points to current price action when specific geometric conditions are met
Validates square formation by checking if the price movement follows proper Gann angles (typically 45°, 135°, etc.) within a tolerance range
Key Features
Real-time square tracking: Shows both completed squares and forming squares in progress
Support/Resistance levels: Automatically generates S/R lines from:
Square edge extensions
Diagonal extensions (pivot centers)
Quarter/half levels within squares (25%, 50%, 75%)
Visual feedback: Color-coded squares (green for up, red for down, orange for forming)
Projection lines: Predicts where squares might complete based on Gann angle theory
Gann Theory Application
The indicator follows Gann's principle that time and price move in geometric harmony. It looks for price movements that form perfect squares when plotted on a chart, where the diagonal of the square represents the natural flow of price and time at specific angles.
The generated support/resistance levels are particularly valuable because they're based on completed geometric patterns rather than just horizontal price levels, making them potentially more significant according to Gann methodology.

Gann Octave 8 - Professional V 1.0Gann Octave 8 Indicator:
Core Concept: This indicator divides the price range between highest high and lowest low into 8 equal parts (octaves), creating support/resistance levels based on W.D. Gann's trading principles.
Key Components:
1. Price Range Calculation:
o Finds highest high and lowest low over a lookback period (default 50 bars)
o Divides this range into 8 equal segments (12.5% each)
2. 8 Octave Levels:
o 0% (Low Support) - Strongest support
o 12.5%, 25%, 37.5% - Minor levels
o 50% (CRITICAL) - Most important level
o 62.5%, 75%, 87.5% - Minor levels
o 100% (High Resistance) - Strongest resistance
3. Gann Angles: Projects trend lines from high/low points at various angles (1x1, 2x1, 1x2, etc.)
4. Visual Features:
o Color-coded levels
o Information table showing current position
o Background highlighting when near critical levels
o Trend analysis (bullish/bearish zones)
Trading Strategy
Entry Signals:
BULLISH TRADES:
• Price crosses above 50% level → Strong buy signal
• Price bounces from 25% or 37.5% levels → Support bounce
• Price in upper zone (above 50%) → Bullish bias
BEARISH TRADES:
• Price crosses below 50% level → Strong sell signal
• Price rejects at 75% or 87.5% levels → Resistance rejection
• Price in lower zone (below 50%) → Bearish bias
Key Trading Rules:
1. 50% Level is Critical: Most important for trend direction
2. Zone Trading:
o Above 50% = Bullish zone (look for longs)
o Below 50% = Bearish zone (look for shorts)
3. Strength Levels:
o Above 75% or below 25% = Strong moves
o Near 100% (high) or 0% (low) = Extreme levels
Risk Management:
• Stop Loss: Place below previous octave level
• Take Profit: Target next octave level
• Position Size: Reduce size near extreme levels (0%, 100%)
Example Trade:
If price breaks above 50% level:
• Entry: Long position
• Stop: Below 37.5% level
• Target: 75% level
• Risk: Monitor for rejection at resistance levels
The indicator works best in trending markets and helps identify high-probability reversal zones.
Works for both Stocks & Derivatives. Experiment with code and share your feedback in comments..

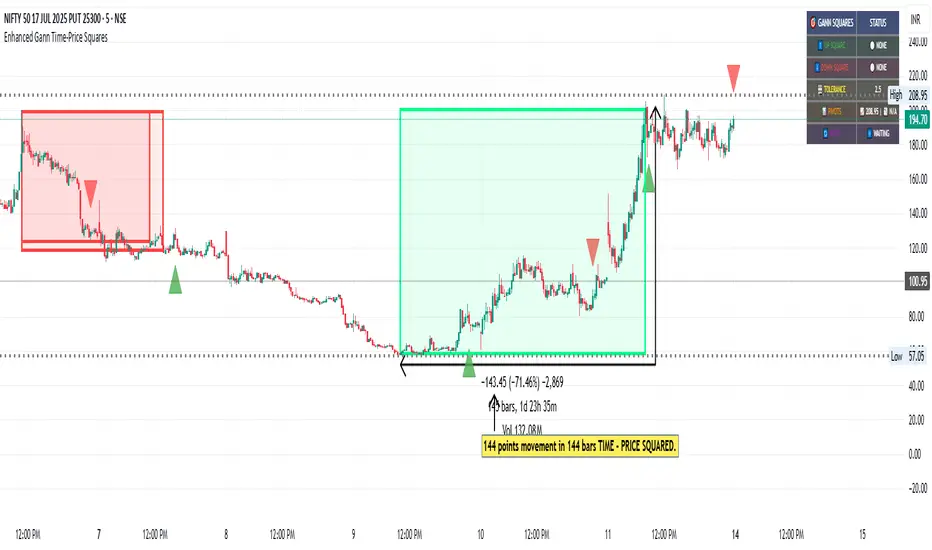
Enhanced Gann Time-Price SquaresEnhanced Gann Time-Price Squares Indicator
A comprehensive Pine Script indicator that identifies and visualizes W.D. Gann's time-price square formations on your charts. This tool helps traders spot potential market turning points where time and price movements align according to Gann's legendary market theories.
Key Features:
Automatic Square Detection - Identifies completed squares where price movement equals time movement
Future Projections - Shows forming squares with projected completion points
Pivot Integration - Automatically detects pivot highs/lows as square starting points
Visual Clarity - Clean box outlines with customizable colors and styles
Smart Filtering - Prevents overlapping squares and includes minimum move thresholds
Real-time Status - Information table showing current square formations
How to Use:
The indicator draws boxes when price moves from pivot points equal the time elapsed (number of bars). Green squares indicate upward movements, red squares show downward movements. Dashed lines show forming squares, while dotted lines project where they might complete.
Settings:
Adjust pivot sensitivity and minimum price moves
Customize tolerance for time-price matching
Toggle projections, labels, and visual elements
Fine-tune colors and line styles
Perfect for Gann theory practitioners and traders looking for time-based market analysis. The squares often coincide with significant support/resistance levels and potential reversal points.
Compatible with all timeframes and instruments.
More updates to follow
Gann Swing PointsIndicator Logic
This is a GANN-style swing indicator that classifies bars based on their high/low structure relative to the previous bar.
I strongly encourage you to replay bars on Tradingview using this indicator to get a sense of how it creates pivot (or swing) points
Bar Classification:
Up-Bar (direction: 'up'): Higher High and Higher Low (HH/HL)
Down-Bar (direction: 'down'): Lower High and Lower Low (LH/LL)
Outside-Bar (generates 2 directions):
Green: 'down' then 'up'
Red: 'up' then 'down'
Inside-Bar: No direction generated (HL/LH)
Swing Line Logic
The swing line continues in the current direction until n opposite directions are detected.
n is the "n-direction" parameter (commonly set to 2, so 2 consecutive opposite direction is needed to turn the swing)
When n opposing directions occur, the swing turns, creating a pivot point
Inside bar is ignored, so e.g up-bar -> inside-bar -> up-bar generates "up", "up" direction
A top pivot is formed when the swing turns down
A bottom pivot is formed when it turns up
Note: This swing logic is inherently lagging — it only confirms tops/bottoms after the fact
This swing structure gives the system a clear and noise-resistant way to identify pivot points (swing-points)

Yearly History Calendar-Aligned Price up to 10 Years)Overview
This indicator helps traders compare historical price patterns from the past 10 calendar years with the current price action. It overlays translucent lines (polylines) for each year’s price data on the same calendar dates, providing a visual reference for recurring trends. A dynamic table at the top of the chart summarizes the active years, their price sources, and history retention settings.
Key Features
Historical Projections
Displays price data from the last 10 years (e.g., January 5, 2023 vs. January 5, 2024).
Price Source Selection
Choose from Open, Low, High, Close, or HL2 ((High + Low)/2) for historical alignment.
The selected source is shown in the legend table.
Bulk Control Toggles
Show All Years : Display all 10 years simultaneously.
Keep History for All : Preserve historical lines on year transitions.
Hide History for All : Automatically delete old lines to update with current data.
Individual Year Settings
Toggle visibility for each year (-1 to -10) independently.
Customize color and line width for each year.
Control whether to keep or delete historical lines for specific years.
Visual Alignment Aids
Vertical lines mark yearly transitions for reference.
Polylines are semi-transparent for clarity.
Dynamic Legend Table
Shows active years, their price sources, and history status (On/Off).
Updates automatically when settings change.
How to Use
Configure Settings
Projection Years : Select how many years to display (1–10).
Price Source : Choose Open, Low, High, Close, or HL2 for historical alignment.
History Precision : Set granularity (Daily, 60m, or 15m).
Daily (D) is recommended for long-term analysis (covers 10 years).
60m/15m provides finer precision but may only cover 1–3 years due to data limits.
Adjust Visibility & History
Show Year -X : Enable/disable specific years for comparison.
Keep History for Year -X : Choose whether to retain historical lines or delete them on new year transitions.
Bulk Controls
Show All Years : Display all 10 years at once (overrides individual toggles).
Keep History for All / Hide History for All : Globally enable/disable history retention for all years.
Customize Appearance
Line Width : Adjust polyline thickness for better visibility.
Colors : Assign unique colors to each year for easy identification.
Interpret the Legend Table
The table shows:
Year : Label (e.g., "Year -1").
Source : The selected price type (e.g., "Close", "HL2").
Keep History : Indicates whether lines are preserved (On) or deleted (Off).
Tips for Optimal Use
Use Daily Timeframes for Long-Term Analysis :
Daily (1D) allows 10+ years of data. Smaller timeframes (60m/15m) may have limited historical coverage.
Compare Recurring Patterns :
Look for overlaps between historical polylines and current price to identify potential support/resistance levels.
Customize Colors & Widths :
Use contrasting colors for years you want to highlight. Adjust line widths to avoid clutter.
Leverage Global Toggles :
Enable Show All Years for a quick overview. Use Keep History for All to maintain continuity across transitions.
Example Workflow
Set Up :
Select Projection Years = 5.
Choose Price Source = Close.
Set History Precision = 1D for long-term data.
Customize :
Enable Show Year -1 to Show Year -5.
Assign distinct colors to each year.
Disable Keep History for All to ensure lines update on year transitions.
Analyze :
Observe how the 2023 close prices align with 2024’s price action.
Use vertical lines to identify yearly boundaries.
Common Questions
Why are some years missing?
Ensure the chart has sufficient historical data (e.g., daily charts cover 10 years, 60m/15m may only cover 1–3 years).
How do I update the data?
Adjust the Price Source or toggle years/history settings. The legend table updates automatically.

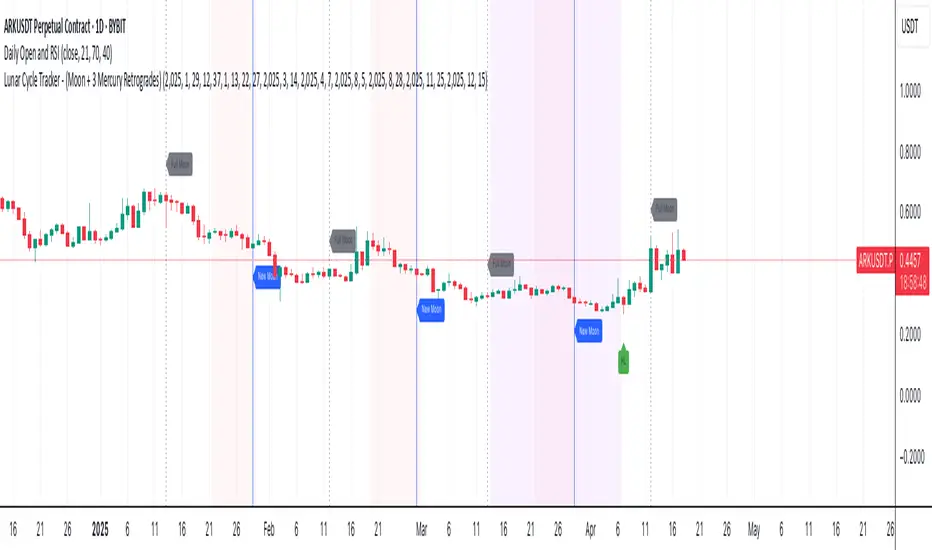
Lunar Cycle Tracker - (Moon + 3 Mercury Retrogrades)This script overlays the lunar and Mercury retrograde cycles directly onto your chart, helping traders visualize natural timing intervals that may influence market behavior.
Key Features:
🌑 New Moon & Full Moon Markers:
Vertical lines and labels indicate new and full moon events each month. You can fully customize their colors.
🌗 Last Quarter Moon Fill:
A soft pink background highlights the last quarter moon phase (from 7.4 days after the full moon to the next new moon).
🪐 Three Mercury Retrograde Zones:
Highlight up to three retrograde periods per year with customizable date inputs and background color. Great for spotting potential reversal or volatility windows.
Customization:
Moon event dates and colors
Manual input for Mercury retrograde periods (year, month, day)
Full compatibility with all timeframes (1H, 4H, daily, etc.)
Great for astro-cycle traders, Gann-based analysts, or anyone who respects time symmetry in the markets.
Fully customizable & works across all timeframes.
This tool was created by AngelArt as part of a larger astro-market model using lunar timing and planetary retrogrades for cycle-based market analysis.
Gann Percentage of High & Low Prices for Options - Keanu_RiTzThis Indicator is based on the text from Chapter 4 "Percentage of High & Low Prices" page number "30" from the book "WD Gann 45 years in Wall Street".
This Indicator is to be used on Intraday Timeframes and only on Options Charts (CALL & PUT) and not on any other chart.
The following is the text from that page :-
One of the greatest discoveries I ever made was how to figure the percentage of high and low prices on the averages and individual stocks.
The percentages of extreme high and low levels indicate future resistance levels.
There is a relation between every low price to some future high price and a percentage of the low price indicates what levels to expect the next high price.
At this price you can sell out long stocks and sell short with a limited risk.
The extreme high price or any minor tops are related to future bottoms er low levels.
The percentage of the high price tells where to expect low prices in the future and gives you resistance levels where you can buy with a limited risk.
The most important resistance level is 50% of any high or low price.
Second in importance is 100% on the lowest selling price on the averages or individual stocks.
You must also use 200%, 300%, 400%, 500%, 600% or more, depending upon the price and the Time Periods from High and Low.
Third in importance is 25% of the Lowest price or the Highest price.
Fourth in importance is 121/2% of the extreme Low or extreme High price.
Fifth in importance is 61/4% of the Highest price, but this is only to be used when the averages or individual stocks are selling at very high levels.
Sixth in importance is 33 1/3 and 66 2/3%. These percentages should be calculated and watched for resistance next after 25% and after 50%.
You should always have percentage tables made up on the Industrial Averages and on the individual stocks you trade in in order to know where these important resistance levels are located.
Description :
It plots the Intraday % levels from the highest high and lowest low of that day.
The calculation of these levels is based on the text from Chapter 4 "Percentage of High & Low Prices" page number "30" from the book "WD Gann 45 years in Wall Street".
I developed this indicator to see if those percentages work on Options prices or not,
and from my observation I found that it works wonderfully in Options as well.
These % levels work like magic and act as great Dynamic Support and Resistance levels.
Don't trust my words blindly and see for yourself.
This indicator is for educational and research purpose only.
It does not provide any BUY/SELL signals.

Rev & Line - CoffeeKillerRev & Line - CoffeeKiller Indicator Guide
🔔 Warning: This Indicator Repaints 🔔 This indicator uses real-time calculations that may change based on future price action. As a result, signals (such as arrows, lines, or color changes) **can and will repaint** — meaning they may appear, disappear, or shift after a candle closes.
**Do not rely on this tool alone for live trading decisions.** Use with caution and always confirm with non-repainting tools or additional analysis.(This indicator is designed to show me the full length of the trend and because of this there can be a smaller movement inside of the trend movement)
Welcome traders! This guide will walk you through the Rev & Line indicator, a sophisticated technical analysis tool developed by CoffeeKiller that combines multiple methodologies to identify market pivots, trends, and potential reversal points.
Core Components
1. ZigZag Analysis
- Dynamic pivot detection using ATR (Average True Range)
- Customizable sensitivity through ATR Reversal Factor
- Color-coded trend lines (green for upward, red for downward)
- Optional vertical lines at pivot points
- Real-time pivot point analysis
2. Donchian Channel Integration
- Traditional upper, lower, and middle bands
- Customizable length and displacement
- Channel-based entry signals
- Dynamic market structure visualization
3. Marker Lines System
- Dynamic support/resistance level tracking
- Pivot-based reset mechanism
- Optional fill zones between markers
- Percentage position tracking within range
4. Signal Generation System
- Confluence between ZigZag pivots and Donchian channels
- Up/down arrow visualization
- Alert system
Main Features
ZigZag Settings
- ATR Reversal Factor: Controls pivot sensitivity (default 3.2)
- Customizable line appearance:
Width control (default: 3)
Color selection (green for uptrend, red for downtrend)
Vertical line options at pivot points
Maximum vertical lines display limit
- Hide repainted option for more reliable signals
Donchian Channel Configuration
- Optional channel visibility toggle
- Length parameter for lookback period (default: 20)
- Displace option for time offset
- Bubble offset for visual placement
Marker Lines System
- High/low/middle marker lines with step-line visualization
- Dotted line projections for future reference
- Pivot-based reset mechanism
- Color-coded percentage position display
Signal Generation
- Triangle markers for signals
- Combined ZigZag and Donchian confluence
- Alert system for notifications
Visual Elements
1. Pivot Lines
- Green: Upward price movements
- Red: Downward price movements
- Customizable line width
- Optional vertical pivot markers with style options:
Solid lines for confirmed pivots
Dashed lines for older pivots
Dotted lines for most recent pivots
2. Donchian Channels
- Upper band (red): Resistance level
- Lower band (green): Support level
- Middle band (yellow): Median price line
- Customizable display options
3. Marker Lines
- High marker line (magenta): Tracks highest open price
- Low marker line (cyan): Tracks lowest open price
- Middle marker line (blue): 50% level between high/low
- Dotted line extensions for future price projections
4. Position Tracking
- Percentage position display within marker range
- Real-time calculations from 0% to 100%
- Label system for visual reference
Trading Applications
1. Trend Following
- Enter on confirmed ZigZag pivot points
- Use Donchian channel boundaries as targets
- Trail stops using marker lines
- Monitor for confluence between systems
2. Counter-Trend Trading
- Trade bounces from marker lines
- Use pivot confirmation for entry timing
- Set stops based on recent pivot points
- Target the opposite marker line
3. Range Trading
- Use high/low marker lines to define range
- Trade bounces between upper and lower markers
- Consider middle marker for range midpoint
- Monitor percentage position within range
4. Breakout Trading
- Enter on breaks above/below marker lines
- Confirm with Donchian channel breakouts
- Use ZigZag pivot confirmations
- Wait for arrow signals for additional confirmation
Optimization Guide
1. ZigZag Parameters
- Higher ATR Factor: Less sensitive, major moves only
- Lower ATR Factor: More sensitive, catches minor moves
- Adjust line width for chart visibility
- Balance vertical line count for clarity
2. Donchian Channel Settings
- Longer length: Smoother channels, fewer false signals
- Shorter length: More responsive, but potentially noisier
- Displacement: Offset for historical reference
- Consider timeframe when setting parameters
3. Marker Line Configuration
- Enable/disable based on trading style
- Toggle middle line for additional reference
- Adjust colors for visual clarity
- Enable/disable labels as needed
4. Signal Generation
- Use "Hide repainted" option for more reliable signals
- Combine ZigZag and Donchian signals for confirmation
- Set alerts based on confirmed pivot points
- Balance sensitivity with reliability
Best Practices
1. Signal Confirmation
- Wait for confirmed pivot points
- Check for Donchian channel interactions
- Confirm with price action
- Look for arrow signals at pivot points
2. Risk Management
- Use recent pivot points for stop placement
- Consider marker line boundaries for targets
- Don't trade against strong trends
- Wait for clear confluence between systems
3. Setup Optimization
- Start with default settings
- Adjust based on timeframe
- Fine-tune ATR sensitivity
- Match settings to trading style
Advanced Features
1. Alert System
- Customizable arrow alerts
- Pivot point notifications
- Text message alerts with ticker information
- Once-per-bar frequency option
2. Pivot Detection Logic
The indicator uses a sophisticated state-based approach to detect pivots:
- State transitions between "uptrend," "downtrend," and "undefined"
- ATR-based reversal detection
- Minimum movement threshold for pivot confirmation
- Historical pivot tracking and labeling
3. Marker Line Reset Mechanism
- Marker lines reset based on pivot detection
- Dynamic support/resistance level adjustment
- Percentage position calculation within range
- Automatic updates as market structure changes
Remember:
- Combine multiple confirmation signals
- Use appropriate timeframe settings
- Monitor both ZigZag and Marker signals
- Pay attention to Donchian channel interactions
- Consider market volatility when trading
This indicator works best when:
- Used with proper risk management
- Combined with other technical tools
- Applied to appropriate timeframes
- Signals are confirmed by price action
**DISCLAIMER**: This indicator and its signals are intended solely for educational and informational purposes. They do not constitute financial advice. Trading involves significant risk of loss. Always conduct your own analysis and consult with financial professionals before making trading decisions.

Double Numbered Triangle Chart Progression | RegressionThe Double-Numbered Triangle Progression | Regression Indicator enables forecasting of support and resistance levels by progressing or regressing on the Triangle Chart from a user-selected pivot price. The indicator also plots adjustable pivots on both the chart and the Triangle Price and Time Chart.
How to use to forecast support and resistance levels:
1. Select a Pivot Point: Set the correct price to the pivot by selecting High or Low in the indicator.
2. Set Price Increment: Choose a price increment to adjust the starting price on the Triangle Chart (e.g., 1 or -0.01).
3. Rotate to adjust the number of levels on the Triangle Chart.
4. Plot Levels: Choose the Left Edge, Center, or Right Edge of the Triangle Chart to plot support and resistance levels. These levels automatically expand or decrease depending on the number of levels in step 3. The selected angle's price values are applied to the chart with labels on both sides. The left labels represent the time variable, and the right labels indicate the price. The time variable is used in conjunction with my other indicator "Price and Longitude Angles." The same goes for the Double Numbered Square of Nine indicator.
5. Review Levels: Examine the plotted support and resistance levels with recent market pivots.
6. Identify Correlations: Find the Triangle edge or center that aligns with the most market pivots.
7. The indicator plots user-adjustable pivots on both candles/bars and shows their placement on the Triangle Chart in both Progression and Regression. This visualization helps users identify which angles the highs and lows favor from the selected pivot. Pivot levels' colors can be customized. The close price is plotted on the Triangle Chart in real time with a white background.
Each market has its tendencies, favoring specific angles from the Triangle Chart. The basic idea is to choose between the Left edge, Center, or Right edge of the Triangle to forecast support and resistance levels.
Settings:
Overview:
Example of Forecasting Support and resistance level using this indicator:
In the image above, I am regressing from the significant high at a rate of $-0.008 per cell as shown on the main info label. Based on the plotted pivots, I have chosen the right edge of the triangle as it aligns with these recent pivots. I have drawn a lime green vertical line to indicate that as we add layers to the triangle chart, we introduce support and resistance levels based on the identified angle that aligns with these early pivots from the high.
In the image below, I've moved forward in time to illustrate how the initial angle chosen based on the early pivots forecasted support and resistance levels on $DOGE. Do not expect the price to turn sharply at the levels the indicator generates. As P. Mikula mentions in his work, and I apply the same with the Triangle Chart, " The Square of Nine successfully defines market price swings but does not cause the market to form pivots. "
This indicator is inspired by the methodologies detailed by Patrick Mikula in his book, The Definitive Guide to Forecasting using W.D Gann's Square of Nine. I recommend checking it out. He also mentions another use case as a Triangle Price and Time chart in his book, Gann Scientific Method Unveiled, Volume 2, where you can use my open-source indicator "Price and Longitude Angle" alongside both the Doubled Numbered Square of Nine and this Triangle Chart indicator.
FYI, I am not affiliated with Patrick Mikula in any way.
Planned improvements include adding two more angles: Left Center column and Right Center column as additional options to select.
FYI: Please ensure you select the high when regressing from a high. Also, make sure to add enough layers on the Triangle to see all the pivots. Once you've identified an angle, you can hide the table to gain back space on the chart. Use rounding precision for lower prices.

Doubled Numbered Square of Nine Progression | RegressionThe Doubled Number Square of Nine Progression | Regression Indicator enables forecasting of support and resistance levels using the SQ9 progression or regression from a user-selected pivot price. The indicator also plots adjustable pivots on both the chart and the Square of Nine.
How to use to forecast support and resistance levels:
1. Select a Pivot Point: Choose a top or bottom pivot to use as the starting point. Select High or Low in the indicator to set the correct price to the pivot.
2. Set Price Increment or Decrement: Select a price increment to advance the starting price on the Square of Nine (for example 1 or -0.01).
3. Rotate to add or decrease the number of rungs on the Square on Nine: Rotate the Square of Nine and adjust the dimensions. The horizontal levels correlate to the rotation of the Square of Nine.
4. Plot Levels: Select a Square of Nine angle to plot the support and resistance levels based on the selected increments. These levels auto expand and decrease depending on the number of rotations in step 3. The price values from each of the selected diagonal or cardinal cross are applied to the chart with labels on both left and right. Left labels represent the cell the time variable and the right label is price.
5. Review Levels: Conduct a simple review of the plotted support and resistance levels in relation to recent market pivots.
6. Identify Correlations: Identify the Square of Nine cardinal cross or diagonal cross angle that correlates with the most market pivots.
7. The indicator plots user-adjustable pivots on both candles/bars and displays their placement on the Square of Nine in both Progression and Regression. The close price is plotted on the Square of Nine in real-time with a white background. This helps users identify which angles the highs and lows favor from the selected pivot. The pivot levels' colors can be adjusted.
Each market has its tendencies, favoring specific angles from the cardinal or diagonal cross. The basic idea is to choose between the diagonal cross and cardinal cross angles to forecast support and resistance levels.
Settings:
Overview:
Example on Forecasting Support and resistance level using this indicator:
In the image above, I'm progressing from the significant low at a rate of $200 per cell. Based on the plotted pivots, I've selected the 315-degree angle on the diagonal cross as it aligns with a few recent pivots. Now, I've drawn a vertical line to show that as we add rungs to the Square of Nine, we introduce support and resistance levels based on the identified angle that aligns with these early pivots from the low.
In the image below, I've moved forward in time to show how the initial angle selected based on the early pivot forecasted support and resistance levels around the high in BTC. Do not expect the price to turn sharply at the levels the indicator generates, but use it to help identify SQ9 levels that may form market turns. As P. Mikula mentions in his work, "The Square of Nine successfully defines market price swings but it does not make the market form pivots."
This indicator includes enhancements made to the Gann Square of Nine indicator originally created by @ThiagoSchmitz.
This indicator is inspired by the methodologies detailed by Patrick Mikula in his book " The Definitive Guide to Forecasting using W.D Gann's Square of Nine ." I recommend checking it out. He also mentions another use case as a Price and Time chart in his " Gann Scientific Method Unveiled, Volume 2 ." FYI, I am not affiliated with Patrick Mikula in any way.
Known Issues:
Close price plotted on the Square of Nine in Regression "from a high pivot" takes a current candle to close in order to be plotted. Progression works as expected.

Price and Longitude Angles Planetary Price & Longitude Angles Indicator
This indicator plots planetary price and longitude angles starting from a user-selected date and time, offering a distinctive lens to explore the relationship between price and planetary timing. It supports both heliocentric and geocentric, enabling flexible and in-depth planetary analysis. The angles can be plotted across any time frame for maximum versatility.
How to Use
Once the indicator is loaded, you’ll be prompted to select a starting date and time for your analysis. From there, customize it as follows:
Select Planetary Options:
To plot the price and longitude for a single planet, choose the same planet in both dropdown menus.
To plot the average of two planets, select a different planet in each dropdown.
Set the Price Per Degree of Longitude: Adjust this value to define the scaling of the planetary angles relative to price.
Customize Fan Settings:
Toggle the mirroring of the fan on or off based on your needs.
Show or hide specific angle divisions to tailor the display to your preferences.
Display or conceal the information label that indicates the price per longitude and the number of degrees traveled.
This indicator is inspired by the methodologies of W.D. Gann and Patrick Mikula, expanding on concepts from Gann Scientific Method Unveiled, Volume 2. It was built using Astrolib by @BarefootJoey
I crafted this tool through dedication to support my own study of these ideas. I’m sharing it open-source not only to deepen my understanding and honor the work of Gann and Mikula, but also to invite collaboration. There’s always room for improvement—whether in functionality, accuracy, or design—and I hope others will join me in refining it. This is for those like me: eager to explore these concepts but lacking tools to experiment with. Let’s build on it together.

WD Gann: Vertical Lines for Predefined Days/Bars AgoThis Pine Script draws vertical lines on the chart at specific time intervals, inspired by WD Gann’s theories of time cycles . WD Gann, a famous trader, believed that market movements were influenced by predictable time cycles. This script enables traders to visualize these key time cycles on the chart by placing vertical lines at predefined intervals (in bars ago), helping to identify potential turning points in the market.
The time intervals used in this script are inspired by Gann’s work, as well as astrological and numerological principles , which many traders believe influence market behavior . You can customize which time intervals (such as 3, 7, 9, 21, etc.) you want to track by enabling or disabling specific vertical lines on the chart.
Key Features:
Time Cycles Based on Gann’s Theory: Draws vertical lines at significant time intervals such as 3, 7, 9, 21, 27 bars ago, which are commonly used by Gann traders.
Astrological & Numerological Significance: The predefined intervals also align with key numerological and astrological values, allowing for a broader perspective on market cycles.
Customizable Intervals: You can choose which time intervals to display by enabling or disabling checkboxes for each cycle, allowing flexibility in chart analysis.
Visual Labels: Each vertical line is labeled with its corresponding "bars ago" value, providing clear reference points for the selected time cycles.
What Users Can Do:
Track and analyze market movements based on time cycles that are significant to Gann’s theory, as well as numerological and astrological influences.
Enable or disable vertical lines for specific cycles, like the 3-bar cycle, 9-bar cycle, or 365-bar cycle, depending on the intervals that align with your trading strategy.
Combine with other technical analysis tools and Gann techniques (e.g., Gann Angles, Gann Fans, or Square of Nine) for a more comprehensive trading approach.
This tool is designed for traders who believe in the power of time cycles to influence market behavior, and is especially useful for predicting turning points or key price movements based on these cycles.

WD Gann: Close Price X Bars Ago with Line or Candle PlotThis indicator is inspired by the principles of WD Gann, a legendary trader known for his groundbreaking methods in time and price analysis. It helps traders track the close price of a security from X bars ago, a technique that is often used to identify key price levels in relation to past price movements. This concept is essential for Gann’s market theories, which emphasize the relationship between time and price.
WD Gann’s analysis often revolved around specific numbers that he considered significant, many of which correspond to squared numbers (e.g., 1, 4, 9, 16, 25, 36, 49, 64, 81, 100, 121, 144, 169, 196, 225, 256, 289, 324, 361, 400, 441, 484, 529, 576, 625, 676, 729, 784, 841, 900, 961, 1024, 1089, 1156, 1225, 1296, 1369, 1444, 1521, 1600, 1681, 1764, 1849, 1936). These numbers are believed to represent natural rhythms and cycles in the market. This indicator can help you explore how past price levels align with these significant numbers, potentially revealing key price zones that could act as support, resistance, or reversal points.
Key Features:
- Historical Close Price Calculation: The indicator calculates and displays the close price of a security from X bars ago (where X is customizable). This method aligns with Gann's focus on price relationships over specific time intervals, providing traders with valuable reference points to assess market conditions.
- Customizable Plot Type: You can choose between two plot types for visualizing the historical close price:
- Line Plot: A simple line that represents the close price from X bars ago, ideal for those who prefer a clean and continuous representation.
- Candle Plot: Displays the close price as a candlestick chart, providing a more detailed view with open, high, low, and close prices from X bars ago.
- Candle Color Coding: For the candle plot type, the script color-codes the candles. Green candles appear when the close price from X bars ago is higher than the open price, indicating bullish sentiment; red candles appear when the close is lower, indicating bearish sentiment. This color coding gives a quick visual cue to market sentiment.
- Customizable Number of Bars: You can adjust the number of bars (X) to look back, providing flexibility for analyzing different timeframes. Whether you're conducting short-term or long-term analysis, this input can be fine-tuned to suit your trading strategy.
- Gann Method Application: WD Gann's methods involved analyzing price action over specific time periods to predict future movements. This indicator offers traders a way to assess how the price of a security has behaved in the past in relation to a chosen time interval, a critical concept in Gann's theories.
How to Use:
1. Input Settings:
- Number of Bars (X): Choose the number of bars to look back (e.g., 100, 200, or any custom period).
- Plot Type: Select whether to display the data as a Line or Candles.
2. Interpretation:
- Using the Line plot, observe how the close price from X bars ago compares to the current market price.
- Using the Candles plot, analyze the full price action of the chosen bar from X bars ago, noting how the close price relates to the open, high, and low of that bar.
3. Gann Analysis: Integrate this indicator into your broader Gann-based analysis. By looking at past price levels and their relationship to significant squared numbers, traders can uncover potential key levels of support and resistance or even potential reversal points. The historical close price can act as a benchmark for predicting future market movements.
Suggestions on WD Gann's Emphasis in Trading:
WD Gann’s trading methods were rooted in several key principles that emphasized the relationship between time and price. These principles are vital to understanding how the "Close Price X Bars Ago" indicator fits into his overall analysis:
1. Time Cycles: Gann believed that markets move in cyclical patterns. By studying price levels from specific time intervals, traders can spot these cycles and predict future market behavior. This indicator allows you to see how the close price from X bars ago relates to current market conditions, helping to spot cyclical highs and lows.
2. Price and Time Squaring: A core concept in Gann’s theory is that certain price levels and time periods align, often marking significant reversal points. The squared numbers (e.g., 1, 4, 9, 16, 25, etc.) serve as potential key levels where price and time might "square" to create support or resistance. This indicator helps traders spot these historical price levels and their potential relevance to future price action.
3. Geometric Angles: Gann used angles (like the 45-degree angle) to predict market movements, with the belief that prices move at specific geometric angles over time. This indicator gives traders a reference for past price levels, which could align with key angles, helping traders predict future price movement based on Gann's geometry.
4. Numerology and Key Intervals: Gann paid particular attention to numbers that held significance, including squared numbers and numbers related to the Fibonacci sequence. This indicator allows traders to analyze price levels based on these key numbers, which can help in identifying potential turning points in the market.
5. Support and Resistance Levels: Gann’s methods often involved identifying levels of support and resistance based on past price action. By tracking the close price from X bars ago, traders can identify past support and resistance levels that may become significant again in future market conditions.
Perfect for:
Traders using WD Gann’s methods, such as Gann angles, time cycles, and price theory.
Analysts who focus on historical price levels to predict future price action.
Those who rely on numerology and geometric principles in their trading strategies.
By integrating this indicator into your trading strategy, you gain a powerful tool for analyzing market cycles and price movements in relation to key time intervals. The ability to track and compare the historical close price to significant numbers—like Gann’s squared numbers—can provide valuable insights into potential support, resistance, and reversal points.
Disclaimer:
This indicator is based on the methods and principles of WD Gann and is for educational purposes only. It is not intended as financial advice. Trading involves significant risk, and you should not trade with money that you cannot afford to lose. Past performance is not indicative of future results. The use of this indicator is at your own discretion and risk. Always do your own research and consider consulting a licensed financial advisor before making any investment decisions.

Gann Square of 9Understanding the Gann Square of 9
Delve into the fascinating realm of W.D. Gann’s Square of 9, a tool that has intrigued traders for generations. As we explore the insights behind this unique structure, we’ll show you how our Gann Square of 9 Indicator can become a valuable asset in your trading toolkit.
The History of the Gann Square of 9
The story behind the Gann Square of 9 is as fascinating as the man who created it. W.D. Gann, a pioneering trader from the early 20th century, introduced a method that highlighted the connection between time and price. Rooted in ancient mathematics and geometry, Gann’s theory suggests that financial markets follow cyclical patterns, which are captured in the design of the Square of 9.
Core Principles of the Gann Square of 9
At its heart, the Gann Square of 9 is based on a numerical system that spirals outward from a central point. This unique arrangement allows traders to identify potential support and resistance levels in the market. Each number represents a possible pivot point, indicating shifts in market direction, aligned with Gann’s time-price equilibrium theory.
Applying the Gann Square in Market Analysis
The strength of the Gann Square of 9 lies in its ability to predict key moments in the market where significant price movements may occur. By utilizing our Gann Square of 9 Indicator, traders can easily pinpoint these crucial points, applying Gann’s principles to anticipate both market highs and lows. This section will guide you through practical applications of the Gann Square for making both short-term and long-term trading decisions.
Market Timing with the Gann Square of 9 Indicator
Unlock the potential of market timing and price prediction using our Gann Square of 9 Indicator. This versatile tool brings Gann’s trading insights into the modern world of finance. Here, you’ll find a detailed walkthrough on how to use the indicator to enhance your trading strategies.
Step-by-Step Guide
Input the Source Price: Open, High, Low, Close on specific Timeframe.
Set the Pip Value: Adjust the pip value according to the scale of your trades. The pip value helps define the precision of the price levels the calculator will generate.
Analyze Results: The generated grid displays a central value (your input price) surrounded by numbers representing possible support and resistance levels.
Use the Support and Resistance Levels: Below the grid, you’ll find specific support and resistance points. These are key price levels that can help you plan your trading strategy, such as entry or exit points.
Apply Gann's Trading Entries: At the bottom, suggested long and short trade entries, with targets and stop-loss levels, giving you essential tools for managing risk effectively.
By following these steps, you can effectively incorporate Gann’s time-tested techniques into modern market analysis. Our Gann Square of 9 Indicator simplifies complex calculations while offering powerful insights, helping you make informed trading decisions rooted in one of market analysis’s most influential theories.
Whether you’re new to Gann’s approach or a seasoned trader, this indicator is designed to provide valuable insights aligned with Gann’s original concepts while delivering a seamless user experience for today’s traders. With just a few clicks, you can transform market data into a geometric pattern of time and price, setting the stage for strategic trading based on the cyclical nature of financial markets.

Gann Levels 360
This indicator plots a series of horizontal lines on a chart based on pre-defined levels and the current market price. These levels are believed to be significant for potential support and resistance zones according to the Gann trading methodology.
This code defines a custom indicator that plots a set of Gann levels and dynamically adjusts them based on the current market price. Users can change the line color through the input option.

Historical Swing High-Low Gann IndicatorThe Historical Swing High-Low Gann Indicator is a powerful tool designed to track and visualize key market swing points over time. This indicator identifies significant swing highs and lows within a specified time frame and draws connecting lines between these points, allowing traders to observe the natural ebb and flow of the market.
What sets this indicator apart is its ability to maintain all previously drawn swing lines, creating a comprehensive historical view of market movements. Additionally, the indicator projects Gann-style lines from the most recent swing highs and lows, providing traders with potential future support and resistance levels based on the geometric progression of price action.
Features:
Swing Detection: Automatically detects significant swing highs and lows over a user-defined period (default is 3 hours).
Persistent Historical Lines: Keeps all previously drawn lines, offering a complete visual history of the market's swing points.
Gann-Style Projections: Draws forward-looking lines from the latest swing points to help predict possible future market levels.
Customizable Parameters: Allows users to adjust the swing detection period to suit different trading styles and time frames.
This indicator is ideal for traders who rely on price action, support and resistance levels, and Gann theory for their analysis. Whether used in isolation or as part of a broader strategy, the Historical Swing High-Low Gann Indicator provides valuable insights into the market's behavior over time.

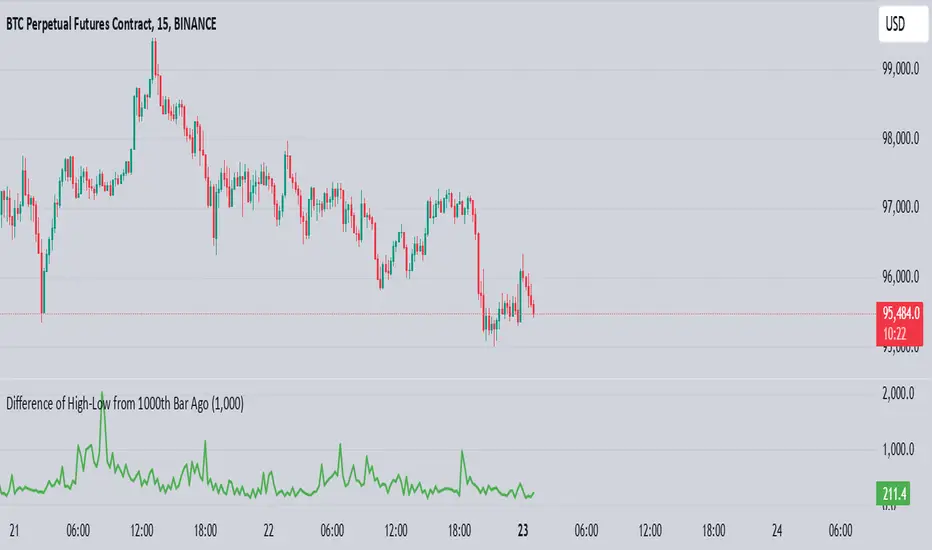
High-Low of X BarOverview
The High-Low of X Bar indicator allows traders to visualize historical high and low values from a specific number of bars ago directly on the chart.
Provides insight into past price action by displaying high, low, and their difference at the most recent bar.
Customizable inputs and color settings for labels enhance usability and visual integration with your chart.
Key Features
Historical Data Analysis: Displays the high, low, and the difference between these values from a specified number of bars ago.
Customizable Inputs: Set the number of bars ago to review historical price points, with a range from 1 to 2000 bars. Premium users can exceed this range.
Dynamic Labeling: Option to show high, low, and difference values as labels on the chart, with customizable text and background colors.
Color Customization: Customize label colors for high, low, and difference values, as well as for cases with insufficient bars.
Inputs
Number of Bars Ago: Enter the number of bars back from the current bar to analyze historical high and low values.
Show High Value: Toggle to display the historical high value.
Show Low Value: Toggle to display the historical low value.
Show Difference Value: Toggle to display the difference between high and low values.
Color Settings
High Label Background Color: Set the background color of the high value label.
High Label Text Color: Choose the text color for the high value label.
Low Label Background Color: Set the background color of the low value label.
Low Label Text Color: Choose the text color for the low value label.
Difference Label Background Color: Set the background color of the difference label.
Difference Label Text Color: Choose the text color for the difference label.
Not Enough Bars Label Background Color: Set the background color for the label shown when there are insufficient bars.
Not Enough Bars Label Text Color: Choose the text color for the insufficient bars label.
Usage Instructions
Add to Chart: Apply the High-Low of X Bar indicator to your TradingView chart.
Configure Settings: Adjust the number of bars ago and display options according to your analysis needs.
Customize Appearance: Set the colors for the labels to match your chart's style.
Analyze: Review the high, low, and their difference directly on your chart for immediate insights into past price movements.
Notes
Ensure your chart has sufficient historical data for the indicator to function properly.
Customize label visibility and colors based on your preference and trading strategy.
GL Gann Swing IndicatorIntroduction
The GL Gann Swing Indicator is a versatile tool designed to help traders identify market trends, support and resistance areas, and potential reversals. This indicator applies the principles of Gann Swing Charts, a technique developed by W.D. Gann, which focuses on market swings to determine the overall direction and turning points of price action. Gann Swing Charts are a time-tested method of technical analysis that simplifies price action by focusing on significant highs and lows, thereby eliminating market noise and providing a clearer view of the trend.
By analyzing price action and determining swing directions and turning points, the indicator filters out market noise using four distinct bar types:
Up Bar: Higher High, Higher Low
Down Bar: Lower High, Lower Low
Inside Bar: Lower High, Higher Low
Outside Bar: Higher High, Lower Low
This approach helps traders to:
Identify the primary trend direction.
Determine key support and resistance levels.
Recognize potential reversal points.
Filter out minor price fluctuations that do not affect the overall trend.
Features
Bar Types: Display bar types by checking the Show Bar Type box in the indicator's settings. Up bars appear as green upward-pointing triangles, down bars as red downward-pointing triangles, inside bars as grey circles, and outside bars as blue diamonds. These visual aids help traders quickly identify the type of bar and its significance.
Break Lines: These lines highlight when the price rises above a previous swing high or falls below a prior swing low. Green lines indicate breaks of swing highs, while red lines indicate breaks of swing lows. Break lines are enabled by default but can be turned off in the indicator's settings. Break lines provide visual confirmation of trend continuation or reversal.
Bar Count: Bar counts help determine if a swing is overextended and if a reversal is likely. This feature is off by default but can be enabled in the indicator's settings. Users can set a minimum bar count to focus on significant swings. Analyzing the number of bars in a swing can help traders gauge the strength and potential exhaustion of a trend.
Swing MA (Moving Averages): This feature plots the average of a user-defined number of previous swing highs and lows. Options are available to add two moving averages, allowing for both fast and slow averages. Swing MAs can be enabled in the indicator's settings. These moving averages smooth out the price data, making it easier to identify the underlying trend direction.
Why This Indicator is Useful
The GL Gann Swing Indicator is particularly useful for several reasons:
Trend Identification: By focusing on significant price swings, the indicator helps traders identify the primary trend direction, making it easier to align trades with the overall market movement.
Noise Reduction: The indicator filters out minor price fluctuations, allowing traders to focus on meaningful market movements and avoid being misled by short-term volatility.
Support and Resistance Levels: By highlighting key swing highs and lows, the indicator helps traders identify crucial support and resistance levels, which are essential for making informed trading decisions.
Potential Reversals: The indicator's ability to identify overextended swings and potential reversal points can help traders anticipate market turning points and adjust their strategies accordingly.
Customizability: With options to display bar types, break lines, bar counts, and swing moving averages, traders can customize the indicator to suit their specific trading style and preferences.
By incorporating Gann Swing principles, the GL Gann Swing Indicator offers traders a powerful tool to enhance their technical analysis, improve their trading decisions, and ultimately achieve better trading outcomes.

Dynamic Gann Levels [XrayTrades]This indicator dynamically captures the highest and lowest points visible on the chart and calculates Gann Support and Resistance Levels. The inputs are detailed below.
Why create this indicator?
There is no other indicator with the same functionality on TradingView.
These calculations are time-consuming; the speed at which this indicator calculates any number of rotations and degrees and visually displays them on the chart is invaluable to me, and hopefully others who use/perform these calculations.
Works on any time frame:
Year, month, week, day, etc. Smaller timeframes (intraday) for higher prices may require adjusting the y-axis of the chart after the calculation of levels due to the nature of squaring numbers.
Inputs:
Resistance: Up (from pivot low) - This toggles on/off levels calculated from the lowest point visible on the chart’s current view.
Support: Down (from pivot high) - This toggles on/off levels calculated from the highest point visible on the chart’s current view.
360 - Toggles on/off the levels of full rotations (360 degrees) from price
180 - Toggles on/off the levels of half rotations (180 degrees) from price
90 - Toggles on/off the levels of quarter rotations (90 degrees) from price
45 - Toggles on/off the levels of eighth rotations (45 degrees) from price
Full Rotations Visible - The number of rotations to be displayed on the chart
How to use this indicator:
Adjust chart window to change the highs and lows.
Select the degrees, direction, and number of rotations in the indicator settings.
The colored values beside the indicator represent the values (high and low) used in generating the Gann levels. Should the cursor be on the chart, ensure it is to the right of the high and low pivots, as this is dynamic in TradingView depending upon cursor location. Note: This is only for the user to know which value(s) are used; cursor position does not impact actual calculations and levels displayed.
The levels will be drawn to the right of the most recent price, labeled with the degrees and direction as well as the price value at the level.
About the calculations:
These calculations are derived from the Natural Square Calculator of Gann Theory, also known as the Square of Nines.
Details:
Take the square root of the selected value (lowest and or highest point).
Add (for up or subtract for down) 0.25 for every 45 degrees of rotation to the desired calculation.
Square this. Round to two decimal places.
Ex: Low of 100. Calculate Gann resistance level for 360 degrees. (√(100)+2)² = 144.
Ex: High of 100. Calculate Gann support level for 180 degrees. (√(100)-1)² = 81.

Gann Box (Zeiierman)█ Overview
The Gann Box (Zeiierman) is an indicator that provides visual insights using the principles of W.D. Gann's trading methods. Gann's techniques are based on geometry, astronomy, and astrology, and are used to predict important price levels and market trends. This indicator helps traders identify potential support and resistance levels, and forecast future price movements.
Gann used angles and various geometric constructions to divide time and price into proportionate parts. Gann indicators are often used to predict areas of support and resistance, key tops and bottoms, and future price moves.
█ How It Works
The indicator operates by identifying high and low points within a visible range on the chart and drawing a Gann Box between these points. The box is divided into segments based on selected percentages, which represent key levels for observing market reactions. It includes options to display labels, a Gann fan, and Gann angles for analysis. Advanced features allow extending the box into the future for predictive analysis and reversing its orientation for alternative viewpoints.
High and Low Points Identification: It starts by locating the highest and lowest price points visible on the chart.
Gann Box Construction: Draws a box from these points and divides it according to specified percentages, highlighting potential support and resistance levels.
█ How to Use
Support and Resistance Levels
Using a Gann angle to forecast support and resistance is probably the most popular way they are used. This technique frames the market, allowing the analyst to read the movement of the market inside this framework.
The lines within the Gann Box, drawn at the key percentages, create a grid of potential support and resistance levels. As prices fluctuate, these lines can act as barriers to price movement, with the price often pausing or reversing at these intervals.
Forecasting with the 'Extend' Feature: The indicator's ability to extend lines and boxes into the future provides traders with a forward-looking tool to anticipate potential market movements and prepare for them.
Gann Fan: This feature draws lines at a significant price angle, helping traders identify potential support and resistance levels based on the theory that prices move in predictable patterns.
Gann Curves: Gann Curves display dynamic support and resistance levels, aiding in the analysis of momentum and trend strength.
█ Settings
The indicator includes several settings that allow customization of its appearance and functionality:
⚪ General Settings
Reverse: This setting changes the orientation of labels and calculations within the Gann Box, providing alternative analytical perspectives. It essentially flips the Gann Box's direction, which can be useful in different market conditions or analysis scenarios.
Extend: Extends the drawing of Gann lines or boxes into the future beyond the current last bar. This feature is essential for forecasting future price movements and identifying potential support or resistance levels that lie outside the current price action.
⚪ Gann Box
Show Box: Toggles the visibility of the Gann Box on the chart. The Gann Box is a fundamental tool in Gann analysis, highlighting key levels based on selected high and low points to identify potential support and resistance areas.
Show Fibonacci Labels: Controls the display of Fibonacci labels within the Gann Box. These labels mark specific Fibonacci retracement levels, aiding traders in recognizing significant levels for potential reversals.
Box Visibility: Allows users to enable or disable individual boxes within the Gann Box, providing flexibility in focusing on specific levels of interest.
Percentage Levels: Defines the Fibonacci levels within the Gann Box. Traders can adjust these levels to customize the Gann Box according to their specific analysis needs.
Coloring: Customizes the color of each level within the Gann Box, enhancing visual clarity and differentiation between levels.
⚪ Gann Fan
Show Fan: Enables the Gann Fan, which draws lines at significant Gann angles from a particular point on the chart, helping identify potential support and resistance levels.
Fan Percentages and Coloring: Similar to the Gann Box, these settings allow traders to customize which Gann angles are displayed and how they are colored.
⚪ Gann Curves
Show Curves: When enabled, this setting draws Gann Curves on the chart. These curves are based on Gann percentages and provide a dynamic view of support and resistance levels as they adapt to changing market conditions.
Curve Percentages and Coloring: Define which curves are displayed and their colors, allowing for a tailored analysis experience.
⚪ Gann Angles
Show Angles: Toggles the display of Gann Angles, which are crucial for understanding the market's price and time dynamics, offering insights into future support and resistance levels.
Coloring: Customizes the color of the Gann Angles, making it easier to differentiate between various angles on the chart.
█ Alerts
The indicator includes several alert conditions for price breakouts from the Gann Box and specific levels, enabling traders to be notified of significant market movements.
-----------------
Disclaimer
The information contained in my Scripts/Indicators/Ideas/Algos/Systems does not constitute financial advice or a solicitation to buy or sell any securities of any type. I will not accept liability for any loss or damage, including without limitation any loss of profit, which may arise directly or indirectly from the use of or reliance on such information.
All investments involve risk, and the past performance of a security, industry, sector, market, financial product, trading strategy, backtest, or individual's trading does not guarantee future results or returns. Investors are fully responsible for any investment decisions they make. Such decisions should be based solely on an evaluation of their financial circumstances, investment objectives, risk tolerance, and liquidity needs.
My Scripts/Indicators/Ideas/Algos/Systems are only for educational purposes!
