Premium Index TheHuntThe indicator is used to see the difference in price between spot and futures prices. If future price is higher than spot in a rally, the rally isn't backed by real buys (spot) but by dumb perp longs which CAN be bearish . If spot price is higher than futures in a rally, the upside is backed by real money (spot) which is bullish.
The indicator allows you to pick a spot pair to compare it with the future exchanges you want. You can select which future exchange pairs to compare with by ticking them in the settings.
As you can see here on the chart during this last rally the index is high in the green which means the rally is backed by futures and spot ain't really following. This could be a sign of exhaustion.
Index

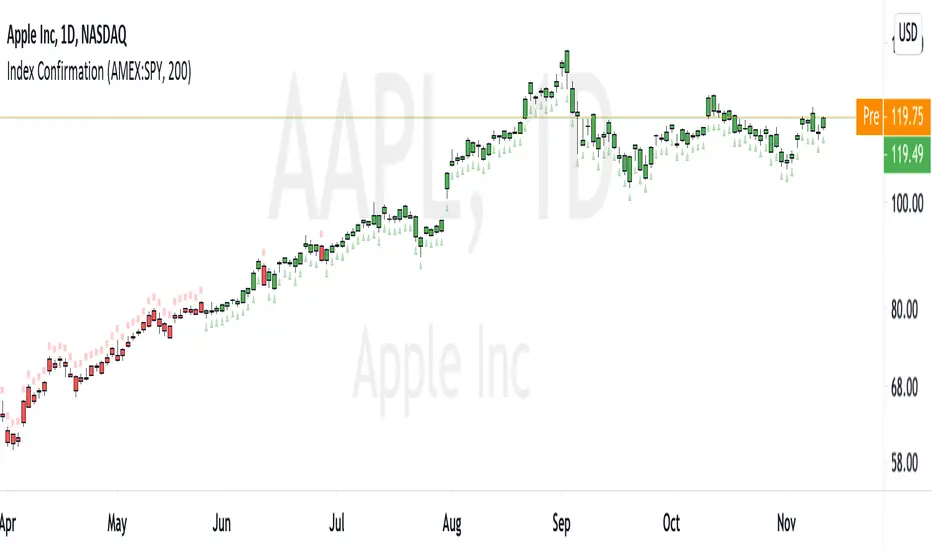
Index ConfirmationThis is a simple Confirmation Indicator that I extensively use in my own trading. Hope others will benefit from it.
Many times, we want to view where the broader index is going before exposing capital to individual stocks. Here's how to use it.
Input the correct Exchange and the Ticker.
Input the Simple Moving Average Period to be applied on the Index/other instrument.
Choose whether bars are colored or dots placed instead or both.
Bars will be colored green if the instrument is above it's moving average & red when below.
Binance Weighted BTC IndexThis is the weighted index for Binance's tether-margined BTC and ETH markets.
It was created to test the accuracy of the weighting and ensure the index was correct. With consideration to the history of tether's effect on Bitfinex's spot market, I had interest in the differences in Bitfinex's USD and UST pairs. Although the difference now is minor, xxx/UST pairs in the index are more accurate.
Options to configure are choosing the base currency, BTC or ETH, and the quote currency, USD or UST (USDT).

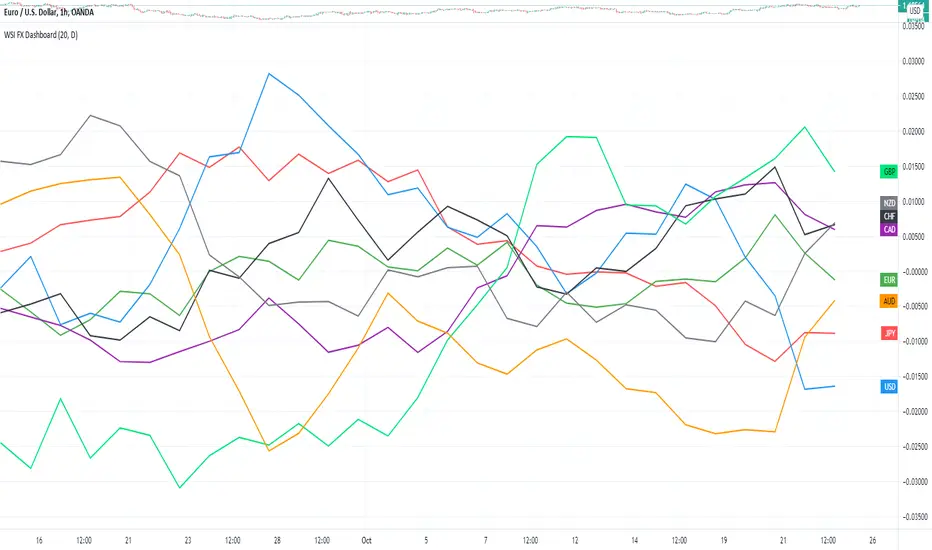
WSI FX DashboardThe WSI (Walton Strength Index) is a currency strength tool designed to show you how individual currencies are performing against each other.
It shows strength for 8 of the major currencies: USD, EUR, GBP, JPY, USD, CAD, AUD, NZD
Each of the lines corresponds to a currency, and you can use those readings to determine which currency pairs you would like to trade.
For example, if the EUR is higher than the rest of the currencies and the USD is lower than the rest of the currencies, then you may consider only buying on the EURUSD.
Don't look at this as an "entry mechanism" for placing trades, but rather a filter mechanism to help you determine which currency pairs might be best for a particular trading strategy that you intend to utilize. Once you have selected a currency pair, or set of currency pairs, then you would go to the individual currency pair charts and perform your usual technical analysis.
The Dashboard can be placed on any chart or timeframe. In the inputs you can select the timeframe you would like to use for the WSI calculations.
For example, if you are on a 1 hour chart and want to see a higher level view of the market, you might set the WSI Dashboard timeframe to Daily.
You can also change the WSI Period, which controls how many candles are used to calculate the strength for each currency.
Here is the 200 Period Daily WSI Dashboard:
ADX Histogram with DI linesInspired by the user scarf from Tradingview. In contrast with that other indicator, this one instead of a simple moving average (SMA) for the ADX calculations, uses a running moving average (RMA) or also known as Wilder's Average. I like having a histogram for the DI lines over just having lines alone because it makes it easier to see. In addition I made it so that values less than 5 for the DI lines are colored lightly to note that the movement was less significant(might not matter but some might care about it, atleast I do). The ADX has a color fainting effect too, and when it goes above the threshold then it becomes black to note that it is trending, as the indicator suggests.
The advantages with these additions and changes are that it shows a more traditional moving average like the original author Wellers Wilder suggested and you can see the crossings and directional movement changes easier from seeing the colors on the histogram easier than you would by looking at the DI lines alone. The disadvantages are you won't be able to tell when the ADX line is above both DI lines and when the ADX then makes a decrease from there(which can sometimes show a reversal), but personally it doesn't matter too much to me and perhaps to those who care more about seeing the direction than having to focus on all those 3 lines crossing all over the place.

Choppiness Index and RSI by ceyhun
Choppiness Index and RSI by ceyhun
This indicator is based on the inverse relationship between CHOP and RSI.
Bar color
If the RSI is greater than CHOP, the Bar color will be blue.
If CHOP is greater than RSI, the bar color will be red.
CHOP
If CHOP is less than 38.2, the color will turn blue. positive
If the CHOP is between 38.2 and 61.8, the color will be yellow and neutral.
If CHOP is greater than 61.8, the color will turn red. negative
Rsi
If Rsi is greater than 61.8, the color will turn blue, positive
If Rsi is between 38.2 and 61.8, the color will be hexagonal and neutral
If Rsi is less than 38.2 the color will be red, negative
The Choppiness Index (CHOP) is an indicator designed to determine if the market is choppy (trading sideways) or not choppy (trading within a trend in either direction). The Choppiness Index is an example of an indicator that is not directional at all. CHOP is not meant to predict future market direction, it is a metric to be used to for defining the market's trendiness only. A basic understanding of the indicator would be; higher values equal more choppiness, while lower values indicate directional trending.
Relative Strength Index (RSI)
The Relative Strength Index (RSI) is a well versed momentum based oscillator which is used to measure the speed (velocity) as well as the change (magnitude) of directional price movements. Essentially the RSI, when graphed, provides a visual mean to monitor both the current, as well as historical, strength and weakness of a particular market. The strength or weakness is based on closing prices over the duration of a specified trading period creating a reliable metric of price and momentum changes. Given the popularity of cash settled instruments (stock indexes) and leveraged financial products (the entire field of derivatives); RSI has proven to be a viable indicator of price movements.

Adaptive Commodity ChannelThis is part 4 of 11 in the system named Ninetales/Volt V2 you can find on Tradingview.
Use it however you would use standard CCI, just add your preferred values to test against each other, and set the period you would like for it to backtest.

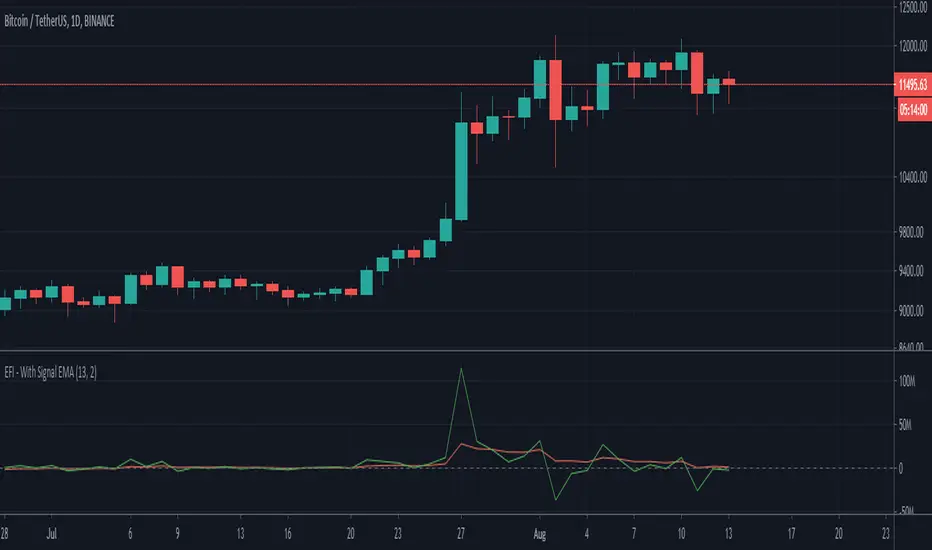
Elders Force Index - With Signal EMA - ValenteSame as Elders Force Index, but with an Additional EMA for buy and sell signal
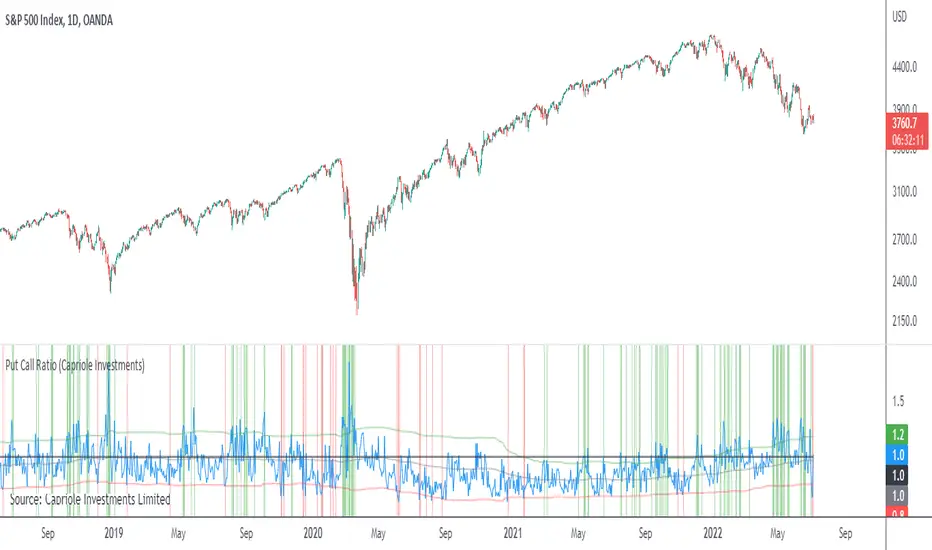
Put Call RatioPlots the CBOE Put Call Ratio and marks up locations of extremities.
Useful as a factor of confluence in identifying extremities in the market.
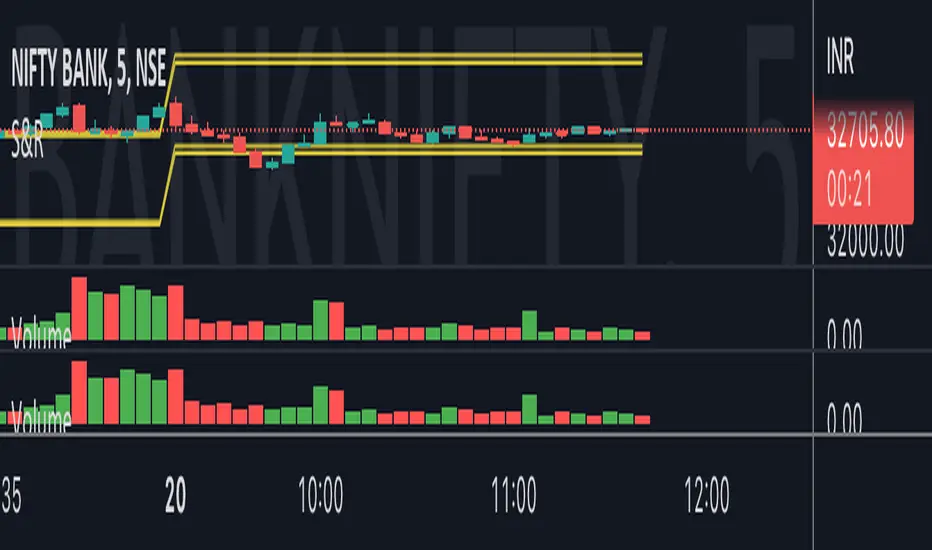
Nifty VolumeWhy this Script : Nifty 50 does not provide volume and some time it is really useful to understand the volume .
This is the pine script which calculate the nifty 50 volume .
Logic :
Take each stock contribute to nifty 50 and find it's volume .
Multiply the same with contribution percentage of the same on Nifty 50
Add up all of them and find the total volume .
There is a similar script by @daytraderph which is built for Bank Nifty (custom volume) . I took the same and built for Nfity.
Nifty has 50 stocks and you cant call security method more than 40 times from one Pine script, so this is the limitation of this script. It consider top 40 stocks and find the volume (which contribute pretty much around 95% of the volume) and convert the same to 100 %
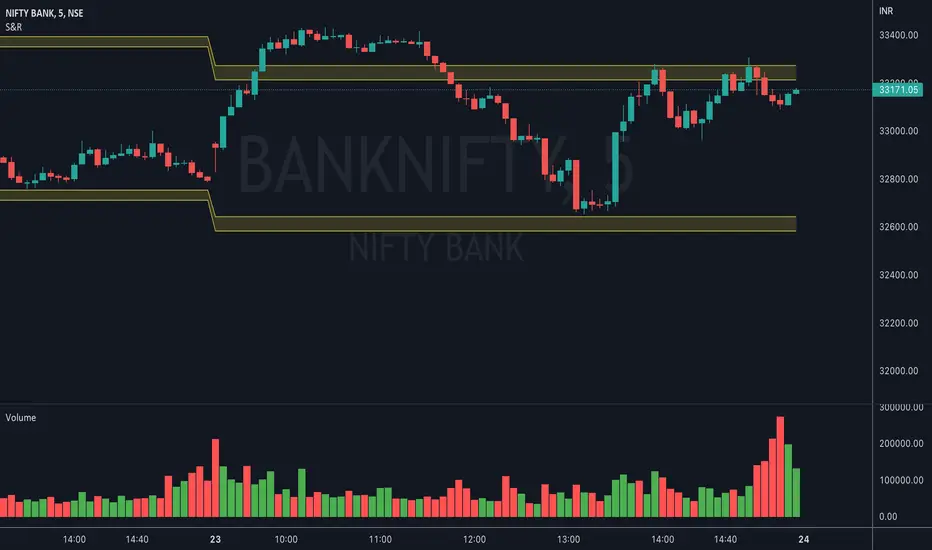
Bank Nifty VolumeWhy this Script : Nifty 50 does not provide volume and some time it is really useful to understand the volume .
This is the pine script which calculate the nifty 50 volume .
Logic :
Take each stock contribute to nifty 50 and find it's volume .
Multiply the same with contribution percentage of the same on Nifty 50
Add up all of them and find the total volume .
I took the open source code from @daytraderph script called, Custom Volume
I will make sure I will update the contribution percentage of all stocks my self instead o you update using input methods. This is the difference. Some people don't know where to look at this to update the value, so for them this script might be useful. And this is the only difference comparing to Custom Volume script.
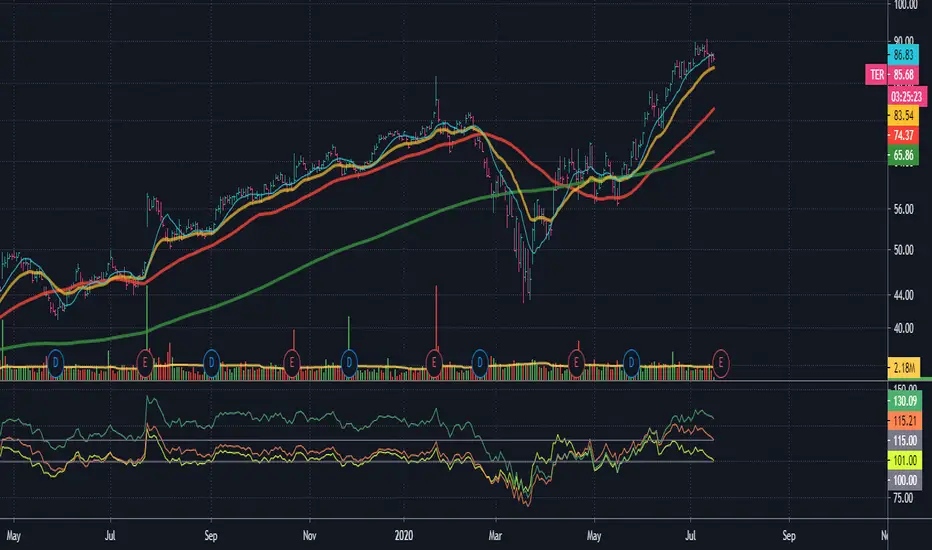
Index SMA vs. CloseVery simple script that index the close price with the SMA 20,50 and 200. It is very useful to plot and see if stocks are extended vs. de SMAs.
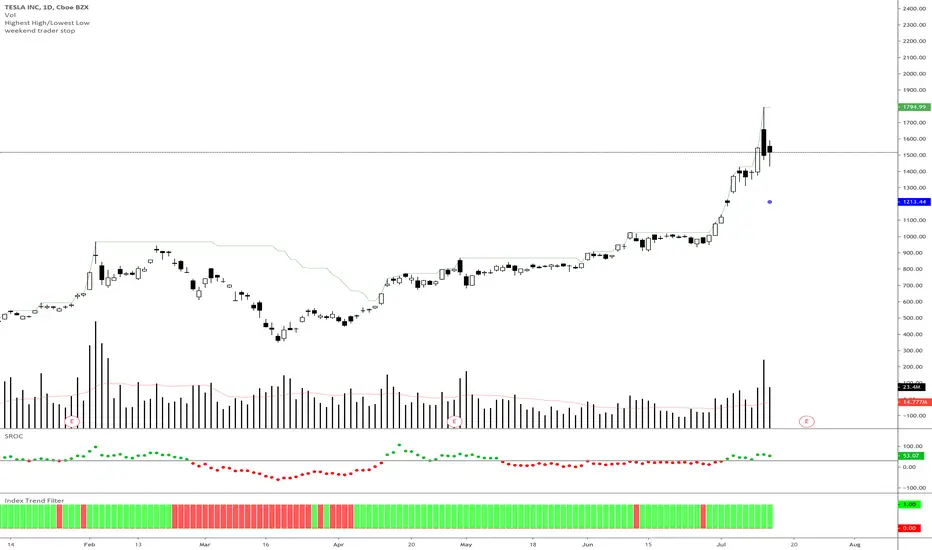
Index Trend Filter - Weekend Trend TraderThis little script simply gives you a quick visual cue of where price is compared to a particular EMA of another security or underlying index.
It is based on Nick Radge's broader market filter weekend trend trader system, but can be applied to other timeframes if you want to confirm if the index is in an up trend or down trend.
• Green means the underlying index price is above the EMA
• Red means the underlying index price is below the EMA
VIX TrendlineThis indicator helps to see the volatility index (VIX) trendline in all stock charts without opening the VIX chart explicitly.
Hope this helps many of you to be more efficient in your chart analysis - have fun!

FauxLife EFIModification to Elder's Force Index (EFI)
Ability to change calculation from standard EMA to your choice of SMA, EMA, WMA, or HMA. Very interesting results!
Adjust lookback from standard/suggested 13 candlesticks
Added a color indication to positive or negative force reading
Added background color tint for an easier read on dashboard setups
Suggested pair with my On Balance Volume with Cross to use as a filter & entry/exit setup. Enter or exit trades when the two indicators switch at the same time or within 1-2 candlesticks of each other.

COT extremes indexCalculates the difference between net of noncommercials and net of commercials.
Difference = (net of noncommercials) - (net of commercials).
The extreme reading in one end or another may indicate the possible change of trend.
Based on Tradingview COT sample script and Babypips formula.
Works on daily timeframe.

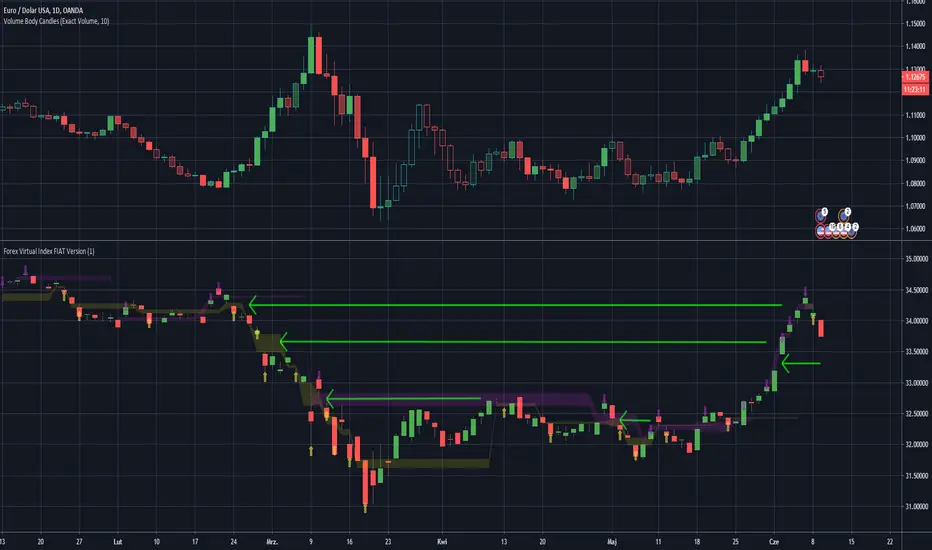
Forex Virtual Index FIAT VersionThis is virtually created FX Fiat pairs index based on OANDAs data.
Pairs are: EUR/USD , AUD/USD , GBP/USD , NZD/USD , AUD/JPY , EUR/JPY , GBP/JPY , USD/JPY , USD/CAD , USD/PLN
Be awared that some pairs like USD/CAD , have reversed correlation to the index.
You may look at the gaps as on standard S/R levels.
ps. Take look inside the scirpt's settings.
ps2. This script is invite-only for the members of our trading group (info in signature, group is free of charge).
{INDYAN} Dual Supertrend#Always follow MAJOR trend, find MINOR trend as per Major trend and choose entry/exit accordingly .
Suppose major trend is blue so only go long while inside minor trend is green, when it turns RED exit from long but dont short in BLUE i.e. major uptrend and vice versa for downtrend i.e. major should be pink and minor should be red for short and when it turn green under pink just exit the sort.
By default major trend is set to 15 Minutes which is generally good for index, and 1 hour should be for stocks. You can change it through settings.
My recommendation for index is major should be 15 minutes and minor 5 and for stocks major should be 1 hour and minor 15 minutes.
It can be used with index,stocks and commodties.
Hope it will help my trader friends.
Happy Trading...
Love INDYAN

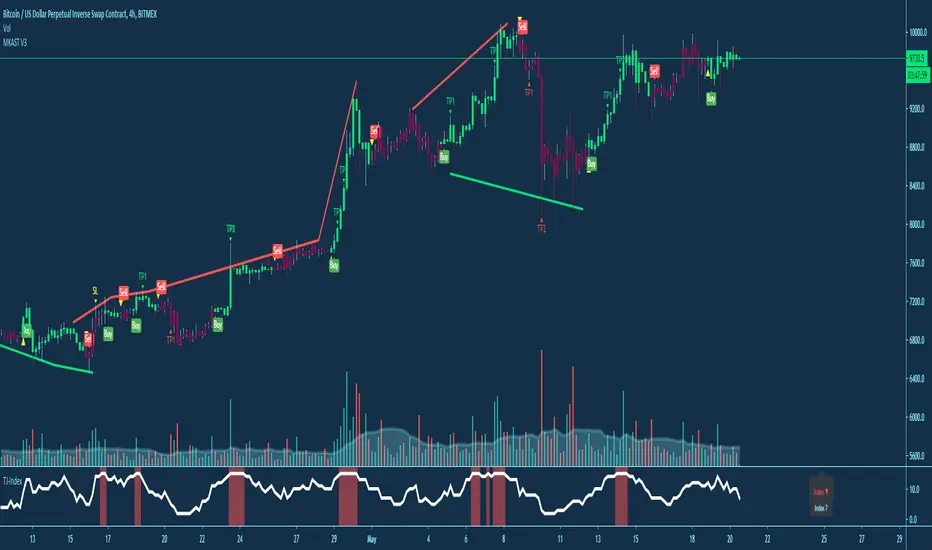
MyAlgoPLEASE READ THE ENTIRE POST BEFORE PURCHASING & USING THE MyAlgo Tool. Saves you and me some time in emails and messages. :)
This is the official version of MyAlgo
PLEASE UNDERSTAND THAT THIS IS A DIFFERENT AND SEPARATE PRODUCT AND SCRIPT FROM "MyAlgo SLIM" FROM THE MyAlgo TRADING TOOL SERIES
Description
Buy & Sell Alerts can be set on all Tickers. This includes, but is not limited to Crypto, Commodities , FOREX, Equities and Indices. Also all candle Types are compatible.
Recommended Time-frames - Due to the complexity of MyAlgo-SLIM the user has a choice between three algorithms and is like that able to trade on all timeframes with the highest returns.
MyAlgo combines many different aspects at the same time, scans multiple other Algorithms and comes to a conclusion based on over 1350 lines of code.
It is based on Divergences, Elliott Waves , Ichimoku , MACD , MACD Histogram, RSI , Stoch , CCI , Momentum, OBV, DIOSC, VWMACD, CMF and multiple EMAs.
Every single aspect is weighted into the decision before giving out an indication.
Most buy/sell Algorithms FAIL because they try to apply the same strategy to every single chart, which
are as individual as humans. To conquer this problem, MyAlgo has a wide range of settings and variables which can be easily
modified.
To make it a true strategy, MyAlgo has as well settings for Take Profit Points and Stop
Losses. Everything with an Alert Feature of course so that FULL AUTOMATION IS POSSIBLE.
I know from experience that many people take one Algorithm and are simply too LAZY to add multiple Algorithms to make a rational choice. The result of that is that they lose money, by following blatantly only one Algorithm.
MyAlgo has additional 15 Indicators, perfect for all markets, which can be turned on and off individually.
Side Notes
MyAlgo is being updated and upgraded very frequently to suit the requests of our customers.
This is not financial advice. Please read our disclaimer before using.
Anything below this sentence will be Updates regarding MyAlgo
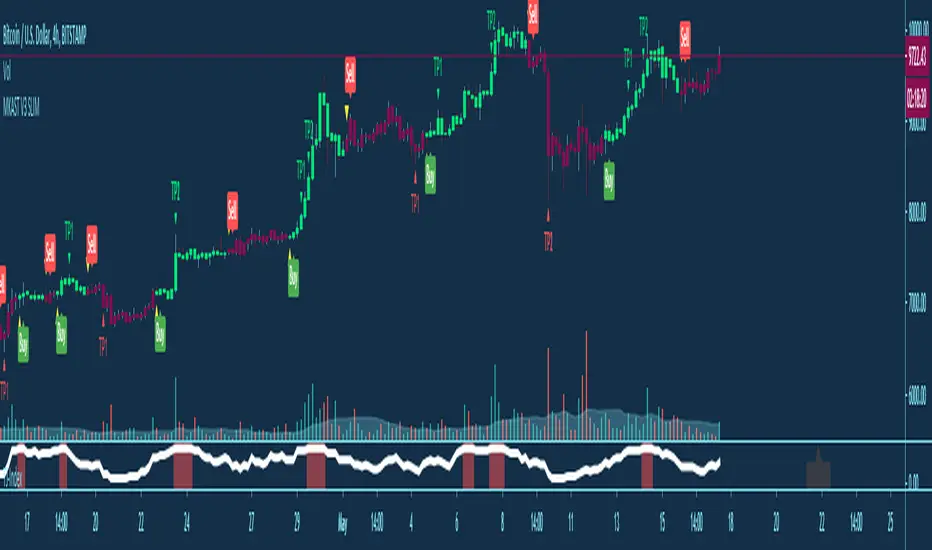
MyAlgo-SLIMPLEASE READ THE ENTIRE POST BEFORE PURCHASING & USING THE MyAlgo-SLIM Tool. Saves you and me some time in emails and messages. :)
This is the official version of MyAlgo-SLIM
Description
Buy & Sell Alerts can be set on all Tickers. This includes, but is not limited to Crypto, Commodities , FOREX, Equities and Indices. Also all candle Types are compatible.
Recommended Time-frames - Due to the complexity of MyAlgo-SLIM the user has a choice between three algorithms and is like that able to trade on all timeframes with the highest returns.
MyAlgocombines many different aspects at the same time, scans multiple other Algorithms and comes to a conclusion based on over 1350 lines of code.
It is based on Divergences, Elliott Waves , Ichimoku , MACD , MACD Histogram, RSI , Stoch , CCI , Momentum, OBV, DIOSC, VWMACD, CMF and multiple EMAs.
Every single aspect is weighted into the decision before giving out an indication.
Most buy/sell Algorithms FAIL because they try to apply the same strategy to every single chart, which
are as individual as humans. To conquer this problem, MyAlgo has a wide range of settings and variables which can be easily
modified.
To make it a true strategy, MyAlgo has as well settings for Take Profit Points and Stop
Losses. Everything with an Alert Feature of course so that FULL AUTOMATION IS POSSIBLE.
I know from experience that many people take one Algorithm and are simply too LAZY to add multiple Algorithms to make a rational choice. The result of that is that they lose money, by following blatantly only one Algorithm.
MyAlgo has additional 15 Indicators, perfect for all markets, which can be turned on and off individually.
Side Notes
MyAlgo is being updated and upgraded very frequently to suit the requests of our customers.
This is not financial advice. Please read our disclaimer before using.
Anything below this sentence will be Updates regarding MyAlgo-SLIM
Cryptocurrency Top10 IndexThis is so called TOP10 Cryptocurrency Index. Automatically calculated from ten of biggest crypto pairs to USD: BTC, ETH, XRP, BCH, BSV, LTC, EOS, XTZ, XLM, XMR.
So far all pairs came from one exchange: Bitfinex. In the future I will add one or two more.
It is coded as Indicator, but you can make it full screen by double-click into its background.
This script is invite-only for the members of our trading group (info in signature).
Polish description:
----------------------
Niniejszy skrypt stanowi sztuczny twór imitujący indeks jednych z dziesięciu największych kryptowalut w parze do USD: BTC, ETH, XRP, BCH, BSV, LTC, EOS, XTZ, XLM, XMR.
Na początek wszystkie pary pochodzą tylko z jednej giełdy: Bitfinex. W przyszłości dodam jedną lub dwie giełdy więcej.
Skrypt jest zaprogramowany jako tzw. wskażnik/indicator ale możesz powiększyć go do pełnego ekranu, klikając dwukrotnie w tło skryptu.
Nardzędzie jest publikowane na zasadzie invite-only(konieczność przydzielenia dostępu na TradingView), a zatem dostępny jest tylko dla aktywnych użytkowników naszej grupy traderskiej, do której link można znaleść w mojej sygnaturze poniżej.

Relative Volume Strength IndexRVSI is an alternative volume-based indicator that measures the rate of change of average OBV.
How to read a chart using it?
First signal to buy is when you see RVSI is close to green oversold levels.
Once RVSI passes above it's orange EMA, that would be the second alert of accumulation.
Be always cautious when it reaches 50 level as a random statistical correction can be expected because of "market noises".
You know it's a serious uptrend when it reaches above 75 and fluctuates there, grading behind EMA.
The best signal to sell would be a situation where you see RVSI passing below it's EMA when the whole thing is close to Red overbought level
It looks simple, but it's powerful!
I'd use RVSI in combination with price-based indicators.

.BXBT IndexThe current .BXBT index weighted as close as possible to BitMEX's with updates as BitMEX refreshes their index.
Difference between this and the script titled '2020 March 27 .BXBT Index': this one will receive updates because it doesn't have a date in its title.
Methodology
www.bitmex.com
"BitMEX Index Weights, assuming no constituent exchanges have been excluded due to Index Protection Rules, last updated 27 December 2019 at 12:00:05 UTC."
Binance: -
Bitstamp: 10.61%
Bittrex: 2.53%
Coinbase: 52.30%
Gemini: 6.89%
Huobi: -
Itbit: 4.21%
Kraken: 23.46%
Poloniex: -
ItBit's weight is combined with Gemini's due to ItBit not being on TradingView as of now. BITTREX:BTCUSD substituted with BITTREX:BTCUSDT*POLONIEX:USDTUSD to backfill because Bittrex only recently (late 2018) started to offer a fiat BTC/USD pair. Not that it matters since the index used in 2018 didn't include Bittrex if I remember correctly.
What is actually used for 27/12/2019 to 27/03/2020:
Binance: -
Bitstamp: 10.61%
Bittrex: 2.53%
Coinbase: 52.30%
Gemini: 11.10%
Huobi: -
Itbit: -
Kraken: 23.46%
Poloniex: -
Options:
Toggle candlesticks or close line
Change price source to be used for indicators
To be added: Change quarter to show indexes for different times, with labels that apply to the appropriate index used
Reasons to use this vs. the index itself: (not many)
It is helpful as a reference for other indicators or creation of an index.
