MissedPrice[KiomarsRakei]█ Overview:
The MissedPrice script identifies price zones based on significant Open Interest shifts (including gaps) aligned with price movements. When sudden market positioning changes occur, the script pinpoints target zones where price is believed to return. Each signal directs you toward these opportunity zones with supporting metrics like Notional Value, Volume Ratio, and Funding Rate timing to help qualify the signals.
█ Core Concept:
Markets frequently "miss" critical price levels during rapid movements. These missed zones occur when:
Orders are revoked during sudden price shifts
Exchanges fail to execute at intended prices
TP/SL orders miss exact execution points
Institutional orders create supply/demand imbalances
Market structure shifts bypass key levels
Liquidity voids form from positioning changes
These missed price zones create natural targets that price tends to revisit. The MissedPrice indicator identifies these zones by analyzing the relationship between Open Interest, Price, and Volume.
█ Closer look at target zones:
Target zones are calculated using the open price where significant OI shifts occur, with zone width adjusted based on the High-Low ratio and ATR to adapt to current volatility. If a zone is touched once after a signal is generated, it is no longer valid. This can be understood as the missing positions and volume having now entered the market.
Each zone's Notional Value (NV) - calculated as OI change multiplied by price - measures the financial impact of the positioning shift. Higher NV indicates more significant market activity and greater liquidity, making price more likely to return to that area. Users can adjust NV ratio thresholds in the inputs to filter signal quality.
█ Features:
Statistical Dashboard: Real-time statistics table showing performance metrics for signals
Funding Rate Visualization: Vertical lines indicate funding rate times to help correlate signals with these significant market events
Alert Capability: Set up alerts for new signals to never miss a trading opportunity
Dynamic Entry Lines: Draws adjustable entry and target level lines to facilitate precise trade execution and measurement, customizable via inputs
█ Closer Look at Statistics Table:
Signal Count: Total numbers of signals generated and total candles included (limited by TradingView's OI historical data)
Win Rate: can be interpreted as the hit rate of target zones. Whenever price reaches the zone, it is calculated as a win, regardless of how far price may have moved in the opposite direction beforehand. This metric measures the script's accuracy in identifying price zones that eventually get revisited.
Total Profit: Calculates possible profit from first entry to target of hit signals - an estimate since humans can't take all signals and might have better entries or average down. By default is turned off can be turned on in the input menu.
Bad Signals: Signals taking too long to complete or moving much further from target
Bad but Hit: Bad signals that eventually hit the target despite early challenges
As you can see in the chart, there are zones that price does not return to touch. There is no guarantee that every identified zone will be reached, which is why the script provides additional qualification metrics to help assess signal probability.
Due to limitations of Open Interest data, you can only use this script on crypto pairs that have Open Interest data available on TradingView. While the script works on any timeframe, it performs best on timeframes less than daily.
█ Best Practices:
Use it in bar replay mode to master the strategy
Try different risk management systems based on how far price goes from the target and your creativity
Use the volume ratio and funding time data to further qualify signals
Notional Value plays a key role
Open_interest

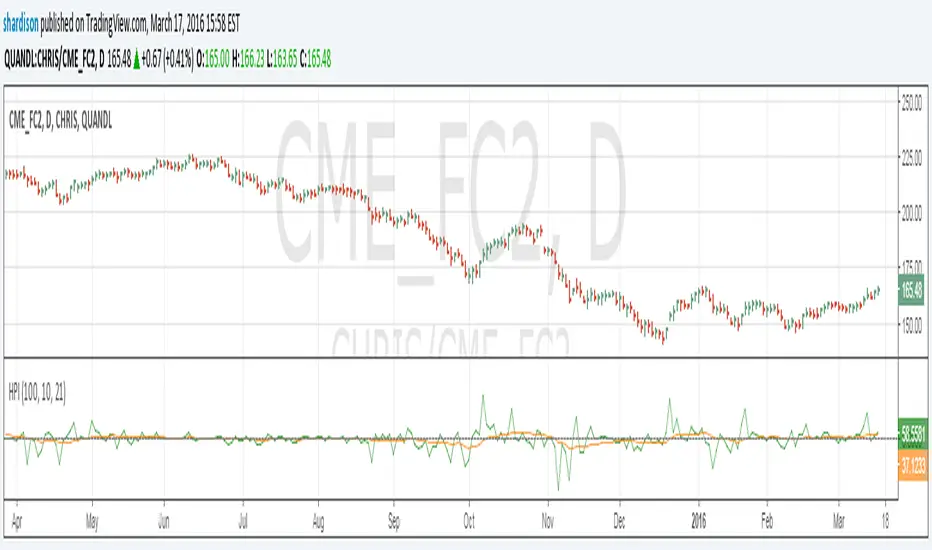
Herrick Payoff Index for Quandl DataUpdate to my previous Herrick Payoff Index script. This script pulls Quandl futures data with daily open interest. The prior version only used the weekly Commitment of Traders open interest data so could only be used on weekly bars. Note: Must use Quandl Symbol methodology in chart (i.e. enter symbol as QUANDL:CHRIS/CME_FC2, QUANDL:CME/FCX2016, ect.). Unfortunately, I haven't been able to program this to pull from the embedded futures data.