DMI Histogram IndicatorThe Directional Movement Index (DMI) was originally developed by J. Welles Wilder Jr. in 1978. Wilder introduced the DMI along with the Average Directional Index (ADX) in his book, “New Concepts in Technical Trading Systems,” which became a foundational reference for technical analysis.
The indicator can be a bit intimidating for people to interpret if they aren't familiar with it. So this DMI Histogram uses the underlying DMI data to present a different way to visualize the price movement and trend. The goal is to help provide insight into the rising or falling momentum behind the price, at times when the chart itself may not be as obvious. This could potentially help spot a momentum divergence before it plays out on the chart.
The user has the option of displaying ADX reversals as red and green arrows. The ADX is the trend indicator portion of the DMI. When it changes direction, that sometimes leads to shift in who is exerting the most influence on the price, buyers or sellers.
The user also has the option of coloring the candlesticks to match the histogram.
This indicator is meant to be combined with other indicators and other chart analysis tools.
متذبذبات

EMA-RSI-ADX Trend Bands
📌 EMA-RSI-ADX Trend Bands (ERA Trend Bands)
🔥 Overview
The ERA Trend Bands indicator combines Exponential Moving Average (EMA), Relative Strength Index (RSI), and Average Directional Index (ADX) into a powerful multi-factor trend system.
It helps traders:
Identify trend direction (Bullish / Bearish)
Measure trend strength using EMA deviation bands
Confirm momentum with RSI & ADX filters
Visualize conditions with dynamic colors, labels, tables, and signals
⚡ Key Features
📍 EMA Trend Bands
EMA100 with gradient glow effect showing trend bias
Strength bands around EMA (Very Weak → Hyper levels)
Bands color-coded for bullish/bearish extremes
📊 RSI + ADX Confluence
Bullish Signal: RSI ≥ threshold & ADX ≥ threshold → 🟢
Bearish Signal: RSI ≤ threshold & ADX ≤ threshold → 🔴
Candles recolored when conditions are met
Auto-generated labels show live RSI/ADX values
🧩 Strength Levels
Classifies deviation from EMA into 8 levels:
Neutral → Very Weak → Weak → Moderate → Strong → Very Strong → Extreme → Hyper
Dashboard table shows deviation % ranges & strength colors
Dynamic labels display Trend, Strength, Deviation %, RSI & ADX
🎨 Visual Enhancements
Gradient EMA line with glow effect
Bullish (greens) & bearish (reds) vibrant palettes
Background coloring (optional) based on strength
Symbols & labels for entry confirmation
🎯 How to Use
Trend Direction – EMA color + deviation bands show whether market is bullish or bearish.
Strength Confirmation – Use strength labels & dashboard table to gauge overextension.
Entry Signals – Watch for RSI/ADX confluence (green/red labels on chart).
Exits – Monitor when strength fades back toward Neutral/Weak levels.
⚙️ Settings & Inputs
EMA Settings → Length, Line Width, Gradient Intensity
RSI Settings → Length & Thresholds (Bullish / Bearish)
ADX Settings → Length & Thresholds (Bullish / Bearish)
Bands → Enable/disable EMA deviation bands
Labels/Table → Toggle strength info display
Colors → Fully customizable vibrant palettes
🚨 Alerts & Signals
Bullish Condition → RSI & ADX above thresholds
Bearish Condition → RSI & ADX below thresholds
Visual confirmation with labels, candles, and background
⚠️ Disclaimer
This script is for educational purposes only.
It does not constitute financial advice.
Always backtest and use proper risk management before trading live.
✨ Add EMA-RSI-ADX Trend Bands (ERA Trend Bands) to your chart to trade with clarity, strength, and precision.

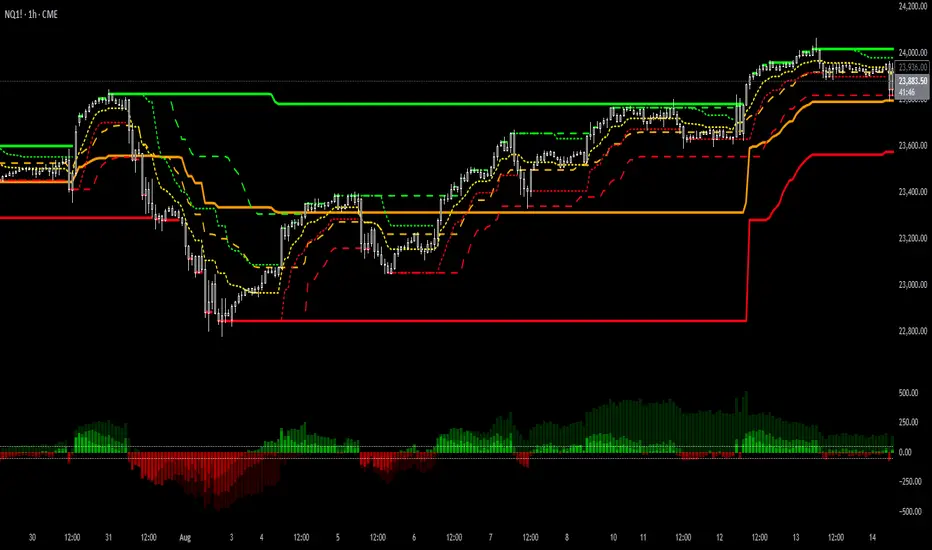
Argentum Flag [AGP] Ver.2.5Central Purpose and Concept
The Argentum Flag script is a multifunctional tool that integrates and visualizes multiple key indicators to provide a detailed and unified perspective of the market. The core concept is to analyze price from different angles—volatility, volume, and momentum—to identify confluences and patterns that may be difficult to see with separate indicators. This "mashup" is not a simple fusion of indicators, but a strategic combination of tools that complement each other to offer a comprehensive view of asset behavior.
Components and Their Functionality
This script combines and visualizes the following elements:
EMA Percentage Bands (EMA Bands):
Uses an Exponential Moving Average (EMA) as a baseline.
Calculates and draws several volatility bands that deviate from the central EMA by fixed percentages (0.47%, 0.94%, 2.36%). These bands are inspired by Fibonacci ratios and the cyclical nature of the market.
The bands are colored with a dynamic gradient that reflects the current state of volatility.
Utility: These bands act as dynamic support and resistance areas. The price entering or exiting these zones can indicate a change in volatility or a possible exhaustion of the movement.
Volatility Signals (Vortex & Prime Signals):
The script generates visual signals when the price stays outside the volatility bands for a specific number of bars.
Vortex Signals (diamond ⍲): Appear when the price crosses and stays outside the Prime bands, suggesting a high volatility or a possible continuation of the trend.
Exit/Entry Signals (circle ⌾): Are activated when the price stays outside the Vortex bands, indicating an extreme extension of volatility. These can be interpreted as potential reversal or profit-taking zones.
Utility: They help traders quickly identify moments of high and low volatility and potential turning points in price action.
Volume Analysis (Volume Bar Colors):
The script changes the color of the bars based on the relationship between the current volume and the average volume over a 50-bar period.
Utility: This feature allows the trader to immediately visualize the strength behind a price movement. For example, a bullish candle with "extreme" volume suggests strong buying interest, while a bearish candle with "low" volume could indicate a weak correction.
Summary Tables (Dashboard):
EMA-Fibo Table: Displays the values of 12 EMAs based on the Fibonacci sequence (5, 8, 13, 21...) in an easy-to-access table. The background color of each value indicates if the current price is above (bullish) or below (bearish) that EMA.
Multi-Timeframe RSI Table: Displays the Relative Strength Index (RSI) values across multiple timeframes (from 1 minute to monthly). The text color changes to highlight if the RSI is in overbought (orange) or oversold (white) areas, according to the established levels.
Utility: These tables condense a large amount of data into a simple format, allowing traders to perform a quick, multi-timeframe market analysis without constantly switching charts.
How to Use the Script
This script is a contextual analysis tool that works best when its different components are combined. It is not a "buy and sell signal" system on its own, but a tool for informed decision-making.
Trend Identification: Use the EMA table to see the general trend direction across different timeframes. A price above most of the EMAs in the table suggests a bullish bias.
Volatility Reading: Observe the EMA bands. If the price stays within the bands, volatility is low. A strong move that breaks out of the bands, accompanied by an "extreme" volume color (blue), suggests strong momentum that could continue.
Momentum Analysis: Use the RSI table to confirm movements. An overbought 15m RSI could support a reversal signal from the Vortex bands, while a 1D RSI in a neutral zone may indicate that the main trend has not changed.
Signal Confirmation: Visual signals (diamond and circle) should not be used in isolation. They must be confirmed by volume analysis and dashboard readings. For example, an "Exit Signal" (circle) with low volume may be less reliable than one with high volume and a clear reversal candle.
Disclaimer
This script is for informational and educational purposes only. It is not financial advice, nor is it a recommendation to buy or sell any financial instrument. All trading involves risk, and past performance is not indicative of future results. The user is solely responsible for their own trading decisions.

Volume Delta Oscillator with Divergence█ OVERVIEW
The Volume Delta Oscillator with Divergence is a technical indicator designed for the TradingView platform, helping traders identify potential trend reversal points and market momentum shifts through volume delta analysis and divergence detection. The indicator combines a smoothed volume delta oscillator with moving average-based signals, overbought/oversold levels, and divergence visualization, enhanced by configurable gradients and alerts for quick decision-making.
█ CONCEPT
The core idea of the indicator is to measure net buying or selling pressure through volume delta, smooth it for greater clarity, and detect divergences between price action and the oscillator. The indicator does not use external data, making it a compromise but practical tool for analyzing market dynamics based on available price and volume data. It provides insights into market dynamics, overbought/oversold conditions, and potential reversal points, with an attractive visual presentation.
█ WHY USE IT?
- Divergence detection: Identifies bullish and bearish divergences between price and the oscillator, signaling potential reversals.
- Volume delta analysis: Measures cumulative volume delta to assess buying/selling pressure, expressed as a percentage for cross-market comparability.
- Signal generation: Creates buy/sell signals based on overbought/oversold level crossovers, zero line crossovers, and moving average zero line crossovers.
- Visual clarity: Uses gradients, fills, and dynamic colors for intuitive chart analysis.
- Flexibility: Numerous settings allow adaptation to various markets (e.g., forex, crypto, stocks) and trading strategies.
█ HOW IT WORKS?
- Volume delta calculation: Computes net buying/selling pressure per candle as volume * (close - open) / (high - low), aggregated over a specified period (Cumulative Delta Length).
- Smoothing: Applies an EMA (Smoothing Length) to the cumulative delta percentage, creating a smoother oscillator (Delta Oscillator).
- Moving Average: Calculates an SMA (Moving Average Length) of the smoothed delta for trend confirmation (Moving Average (SMA)).
- Divergence detection: Identifies bullish and bearish divergences by comparing price and oscillator pivot highs/lows within a specified range (Pivot Length).
- Normalization: Delta is expressed as a percentage of total volume, ensuring consistency across instruments and timeframes.
- Signals: Generates signals for:
Crossing the oversold level upward (buy) or overbought level downward (sell).
Crossing the zero line by the oscillator or moving average (buy/sell).
Bullish/bearish divergences, marked with labels.
- Visualization: Draws the oscillator and moving average with dynamic colors, gradient fills, and transparent bands and labels, with configurable overbought/oversold levels.
- Alerts: Built-in alerts for divergence detection, overbought/oversold crossovers, and zero line crossovers (both oscillator and moving average).
█ SETTINGS AND CUSTOMIZATION
- Cumulative Delta Length: Period for aggregating volume delta (default: 14).
- Smoothing Length (EMA): EMA length for smoothing the delta oscillator (default: 2). Higher values smooth the signal but reduce the number of generated signals.
- Moving Average Length (SMA): SMA length for the moving average line (default: 40). Higher values allow SMA to be analyzed as a trend indicator, but require adjusting overbought/oversold levels for MA, as longer MA oscillates less.
- Pivot Length (Left/Right): Number of candles for detecting pivot highs/lows in divergence calculations (default: 2). Higher values can reduce noise but introduce a delay equal to the set value.
- Overbought/Oversold Levels: Thresholds for the oscillator (default: 18/-18) and for the moving average (default: 10/-10). For the moving average, no arrows appear; instead, the band changes color from gray to green (oversold) or red (overbought), which can strengthen entry signals for delta.
- Signal Type: Select signals to display: "Overbought/Oversold", "Zero Line", "MA Zero Line", "All", or "None" (default: Overbought/Oversold).
- Colors and gradients: Customize colors for bullish/bearish oscillator, moving average, zero line, overbought/oversold levels, and divergence labels.
- Transparency: Adjust gradient fill transparency (default: 70) and band/label transparency (default: 40) for consistent appearance.
- Visualizations: Enable/disable the moving average, gradients for zero/overbought/oversold levels, and gradient fills.
█ USAGE EXAMPLES
- Momentum analysis: Observe the delta oscillator above 0 for bullish momentum or below 0 for bearish momentum. The moving average (SMA), being smoothed, reacts more slowly and can confirm trend direction as a noise filter.
- Reversal signals: Look for buy triangles when the oscillator crosses the oversold level upward, especially when the moving average is below the MA oversold threshold. Similarly, look for sell triangles when crossing the overbought level downward, with the moving average above the MA overbought threshold. Divergence labels (bullish/bearish) indicate potential reversals.
- Divergence trading: Use bullish divergence labels (green) for potential buy opportunities and bearish labels (red) for sell opportunities, especially when confirmed by price action or other indicators.
- Customization: Adjust the cumulative delta length, smoothing, and moving average length to specific instruments and timeframes to minimize false signals.
█ NOTES FOR USERS
- Combine the indicator with other tools, such as Fibonacci levels, RSI, or pivot points, to increase accuracy.
- Test different settings for cumulative delta length, smoothing, and moving average length on your chosen instrument and timeframe to find optimal values.

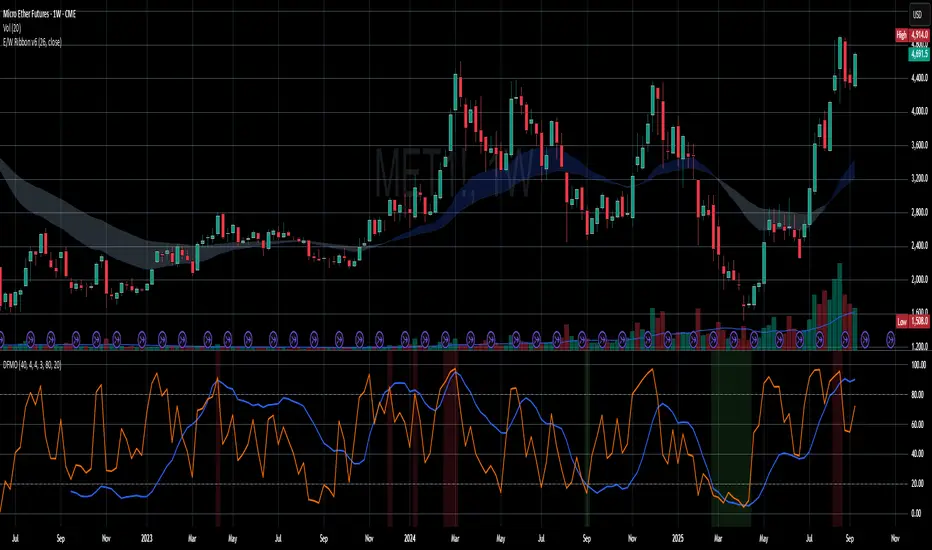
Dual-Frame Momentum OscillatorDual-Frame Momentum Oscillator (DFMO)
This is not just another oscillator. This is a confluence engine, built for the discerning trader who reads the story of price action and needs an objective tool to confirm the climax.
The Dual-Frame Momentum Oscillator was designed to solve a specific problem: how to differentiate a genuine, sustainable breakout from an exhaustive liquidity grab. It provides a visual confirmation for high-probability reversal and scalp setups by measuring momentum across two distinct time frames simultaneously.
This tool is for the trader who understands that indicators should not dictate trades, but rather confirm a well-defined thesis based on market structure, volume, and liquidity.
The Core Concept: Context Meets Trigger
The DFMO fuses a slow, methodical Stochastic with a hyper-sensitive RSI to give you a complete picture of momentum.
The Context (Slow Stochastic %K - default 40,4,4): This acts as your long-term momentum gauge. It tells you if the underlying trend is healthy or nearing exhaustion. A high reading suggests the market is overextended and vulnerable, while a low reading suggests the opposite.
The Trigger (Fast RSI - default 3): This is your immediate impulse reader. It measures the velocity and intensity of the current price thrust, making it incredibly sensitive to exhaustive moves, spikes, and bounces.
By themselves, they are useful. Together, they are formidable.
The Confluence Engine: Your Visual Edge
The true power of the DFMO lies in its "Confluence Engine." The indicator's background highlights in real-time when both oscillators are in agreement, visually flagging moments of maximum opportunity.
Bearish Confluence Zone (Red): The background turns red only when the Stochastic is overbought AND the RSI is overbought. This is your signal that the broader trend is exhausted and the current buying impulse has reached a climax. It is the ideal confirmation for a short entry following a liquidity sweep above a key high.
Bullish Confluence Zone (Green): The background turns green only when the Stochastic is oversold AND the RSI is oversold. This signals that the downtrend is tired and the immediate selling pressure is exhaustive, providing high-probability confirmation for a long entry at a key support level.
When these zones appear, the indicator is telling you that both the context and the trigger are aligned. This removes ambiguity and allows for decisive, confident execution.
Practical Application: The Liquidity Sweep
Imagine you're stalking a short on a futures contract like MCL or MES. You've marked the high of the day (HOD) as a key resistance level where liquidity is resting. You see a sharp, vertical impulse move that breaks the HOD, clearing out the stops.
Is this a real breakout, or is it a manipulation move—a classic liquidity grab?
You glance down at the DFMO. The moment price swept the high, the background flashed red. That's your objective confirmation. The slow Stoch was already overbought, and the fast RSI spiking confirmed the exhaustive, terminal nature of that price thrust. You now have the confidence to enter your short scalp, knowing you are aligned with the probable direction of the market's next move.
This is how you move from "feeling" the market to systematically executing a high-probability edge. This is how you aspire for greatness.
Add the Dual-Frame Momentum Oscillator to your toolkit and transform your ability to time entries with surgical precision.
Adaptive RSIFor traders who want more control, the indicator allows customization of RSI length, smoothing type, and Bollinger Band settings, making it adaptable to day trading, swing trading, and even long-term investing.
In short, this is more than just an RSI — it’s a complete momentum toolkit that combines clarity, flexibility, and advanced signal detection in one clean package.

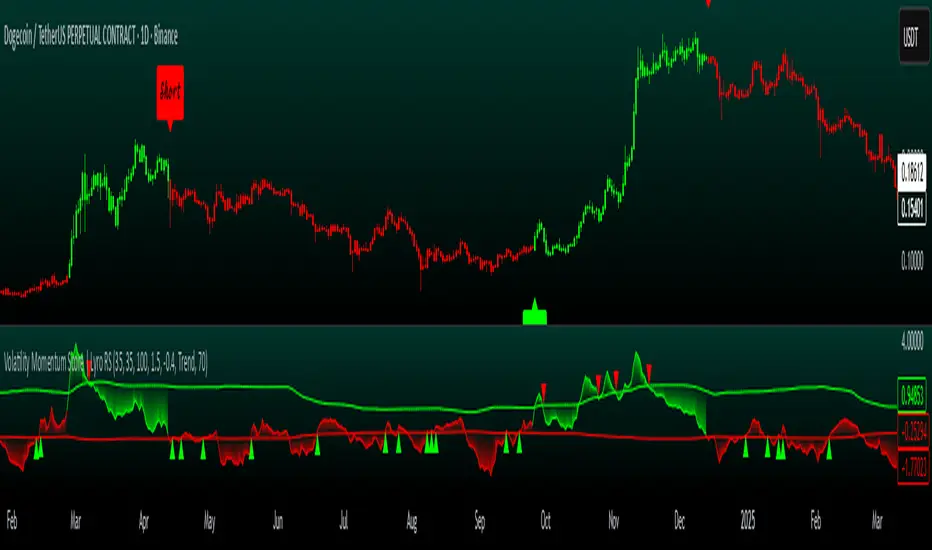
Volatility Momentum Score | Lyro RSVolatility Momentum Score | Lyro RS
Overview
The Volatility Momentum Score (VMS) combines price movement and volatility into a single, easy-to-read signal. Using z-scores, standard deviation bands, and flexible display modes, it helps traders identify trends, overbought/oversold conditions, and potential reversals quickly and effectively.
Key Features
Price + Volatility Blend
Tracks price action and volatility with separate z-scores and merges them into a unified momentum score.
Standard Deviation Bands
Upper and lower bands highlight extreme readings.
Adjustable multipliers allow for fine-tuning sensitivity.
Two Signal Modes
Trend Mode: Plots “Long” and “Short” signals when momentum crosses bands.
Reversion Mode: Colors the chart background when the score indicates stretched conditions.
Overbought & Oversold Alerts
▲ markers indicate oversold conditions.
▼ markers indicate overbought conditions.
Custom Colors
Four preset color themes or fully customizable bullish/bearish colors.
Clear Visuals
Dynamic line coloring based on momentum.
Candles recolored at signal points.
Background shading for quick visual assessment.
How It Works
Calculates z-scores for both price and volatility.
Blends the z-scores into a single average score.
Compares the score against dynamic upper and lower bands.
Triggers signals, markers, or background shading depending on the chosen display mode.
Practical Use
Ride trends: Follow Trend Mode signals to align with momentum.
Spot reversals: Watch ▲ and ▼ markers when markets are overextended.
Stay aware: Background shading highlights potentially overheated conditions.
Customization
Set lookback lengths for price, volatility, and bands.
Adjust band multipliers for more or less sensitive signals.
Choose between Trend or Reversion mode based on trading style.
Select color themes or create custom palettes.
⚠️ Disclaimer
This indicator is a technical analysis tool and does not guarantee results. It should be used alongside other methods and proper risk management. The creators are not responsible for any financial decisions based on its signals.
Bullish_Mayank_entry_Indicator with AlertsThis indiucator gives buy signal alerts using EMAs, RSI & Weighted Moving Average of RSI & also multiframe analysis

Fibo RSIThis is a customized Relative Strength Index (RSI) indicator designed to replicate TradingView’s default RSI while adding additional reference levels for deeper market analysis.
🔹 Features:
RSI length set to 8 by default (user adjustable).
Calculates RSI using the standard ta.rsi() function.
Plots the RSI line in a clean, separate panel.
Adds 7 key levels for analysis: 0, 20, 30, 50, 70, 80, 100.
Levels are drawn as thin, solid straight lines for a cleaner look (instead of default dashed).
🔹 Use cases:
Identify momentum shifts with enhanced precision.
Use intermediate levels (20, 30, 50, 70, 80) as potential support/resistance zones.
Ideal for traders who want a Fibonacci-like structure in RSI analysis.

RMA Smoothed RSIRMA Smoothed RSI
Description:
An enhanced RSI built for cleaner intraday and swing reads. It applies RMA smoothing to damp noise.
How It Works
RSI (RMA-Smoothed):
Computes classic RSI from price changes and smooths the result with an additional RMA (user-controlled 3–7, where 5 is the sweet spot). This reduces whipsaw while preserving shifts in momentum.
How to Interpret
50 Midline = Bias Filter: Above 50 favors strength; below 50 favors weakness.
RSI vs RSI-MA Crosses: Cross up can precede thrust or mean-revert toward 50; cross down the opposite.
Inputs
Length: RSI period (default 14).
Source: Price source for RSI (default Close).
Smoothing: RMA smoothing length on RSI (3–7; default 3; 5 sweet spot).
Calculate Divergence: Toggle to compute pivots/divergences and enable alerts.
Moving Average Type: None, SMA, EMA, WMA, VWMA (default EMA).
MA Length: Length of the RSI-based MA (separate from RSI length).
Best For
Traders who want a cleaner RSI read without losing responsiveness.
Scalpers timing momentum shifts around the 50 line and MA crosses.
Swing traders using divergences as early reversal context.
Pro Tips
For fast intraday charts, start with Length 14, Smoothing 3–5, and EMA as the RSI-MA.
Use 50 reclaims/rejections as a simple regime filter.
Combine divergence labels with volume surges, key S/R, or volatility tools (e.g., BBW/TTM squeeze) to time entries.
Divergence alerts fire only if Calculate Divergence is enabled—keep it on if you rely on signals.

Hilega Milega v6 - Pure EMA/SMA (Nitesh Kumar) + Full BacktestHilega to milega
he Hilega Milega Strategy, inspired by the technique of Nitesh Kumar, is designed for intraday and swing traders who want structured entries and exits with clear demand–supply logic.
🔑 Core Features
Demand & Supply Zones – Automatically plots potential strong buying and selling zones for high-probability trades.
Trend Identification – Uses a blend of EMAs/SMA crossovers to identify bullish and bearish market bias.
Buy & Sell Signals – Generates real-time visual signals based on “Hilega Milega” rules for quick decision-making.
Risk Management – Suggested stop-loss levels are derived from recent demand–supply areas to minimize drawdowns.
Backtesting Enabled – Traders can test the performance across multiple assets (stocks, forex, crypto, commodities).
📊 How It Works
Buy Signal → When price action confirms a bullish zone with supporting trend filters.
Sell Signal → When price action confirms a bearish zone or reversal pattern.
Flat/Exit → Position closed when opposite signal triggers or demand–supply imbalance fades.
⚡ Best Use Cases
Intraday trading (5m, 15m, 1H charts).
Swing trading (4H, Daily charts).
Works across stocks, crypto, commodities, and forex.
⚠️ Disclaimer: This strategy is for educational purposes. Backtest thoroughly and apply proper risk management before live trading.

Signal Generator: HTF EMA Momentum + MACDSignal Generator: HTF EMA Momentum + MACD
What this script does
This indicator combines a higher-timeframe EMA trend filter with a MACD crossover on the chart’s timeframe. The goal is to make MACD signals more selective by checking whether they occur in the same direction as the broader trend.
How it works
- On the higher timeframe, two EMAs are calculated (short and long). Their difference is used as a simple momentum measure.
- On the chart timeframe, the MACD is calculated. Crossovers are then filtered with two conditions:
1.They must align with the higher-timeframe EMA trend.
2.They must occur beyond a small “zero band” threshold, with a minimum distance between MACD and signal lines.
- When both conditions are met, the script can plot BUY or SELL labels. ATR is used only to shift labels up or down for visibility.
Visuals and alerts
- Histogram bars show whether higher-timeframe EMA momentum is rising or falling.
- MACD main and signal lines are plotted with optional scaling.
- Dotted lines show the zero band region.
- Optional large BUY/SELL labels appear when conditions are confirmed on the previous bar.
- Alerts can be enabled for these signals; they trigger once per bar close.
Notes and limitations
- Higher-timeframe values are only confirmed once the higher-timeframe candle has closed.
- Scaling factors affect appearance only, not the logic.
- This is an open-source study intended as a learning and charting tool. It does not provide financial advice or guarantee performance.

Hazel nut BB Strategy, volume base- lite versionHazel nut BB Strategy, volume base — lite version
Having knowledge and information in financial markets is only useful when a trader operates with a well-defined trading strategy. Trading strategies assist in capital management, profit-taking, and reducing potential losses.
This strategy is built upon the core principle of supply and demand dynamics. Alongside this foundation, one of the widely used technical tools — the Bollinger Bands — is employed to structure a framework for profit management and risk control.
In this strategy, the interaction of these tools is explained in detail. A key point to note is that for calculating buy and sell volumes, a lower timeframe function is used. When applied with a tick-level resolution, this provides the most precise measurement of buyer/seller flows. However, this comes with a limitation of reduced historical depth. Users should be aware of this trade-off: if precise tick-level data is required, shorter timeframes should be considered to extend historical coverage .
The strategy offers multiple configuration options. Nevertheless, it should be treated strictly as a supportive tool rather than a standalone trading system. Decisions must integrate personal analysis and other instruments. For example, in highly volatile assets with narrow ranges, it is recommended to adjust profit-taking and stop-loss percentages to smaller values.
◉ Volume Settings
• Buyer and seller volume (up/down volume) are requested from a lower timeframe, with an option to override the automatic resolution.
• A global lookback period is applied to calculate moving averages and cumulative sums of buy/sell/delta volumes.
• Ratios of buyers/sellers to total volume are derived both on the current bar and across the lookback window.
◉ Bollinger Band
• Bands are computed using configurable moving averages (SMA, EMA, RMA, WMA, VWMA).
• Inputs allow control of length, standard deviation multiplier, and offset.
• The basis, upper, and lower bands are plotted, with a shaded background between them.
◉ Progress & Proximity
• Relative position of the price to the Bollinger basis is expressed as percentages (qPlus/qMinus).
• “Near band” conditions are triggered when price progress toward the upper or lower band exceeds a user-defined threshold (%).
• A signed score (sScore) represents how far the close has moved above or below the basis relative to band width.
◉ Info Table
• Optional compact table summarizing:
• - Upper/lower band margins
• - Buyer/seller volumes with moving averages
• - Delta and cumulative delta
• - Buyer/seller ratios per bar and across the window
• - Money flow values (buy/sell/delta × price) for bar-level and summed periods
• The table is neutral-colored and resizable for different chart layouts.
◉ Zone Event Gate
• Tracks entry into and exit from “near band” zones.
• Arming logic: a side is armed when price enters a band proximity zone.
• Trigger logic: on exit, a trade event is generated if cumulative buyer or seller volume dominates over a configurable window.
◉ Trading Logic
• Orders are placed only on zone-exit events, conditional on volume dominance.
• Position sizing is defined as a fixed percentage of strategy equity.
• Long entries occur when leaving the lower zone with buyer dominance; short entries occur when leaving the upper zone with seller dominance.
◉ Exit Rules
• Open positions are managed by a strict priority sequence:
• 1. Stop-loss (% of entry price)
• 2. Take-profit (% of entry price)
• 3. Opposite-side event (zone exit with dominance in the other direction)
• Stop-loss and take-profit levels are configurable
◉ Notes
• This lite version is intended to demonstrate the interaction of Bollinger Bands and volume-based dominance logic.
• It provides a framework to observe how price reacts at band boundaries under varying buy/sell pressure, and how zone exits can be systematically converted into entry/exit signals.
When configuring this strategy, it is essential to carefully review the settings within the Strategy Tester. Ensure that the chosen parameters and historical data options are correctly aligned with the intended use. Accurate back testing depends on applying proper configurations for historical reference. The figure below illustrates sample result and configuration type.

RSI DivergenceThe code originally belongs to Matthew J. Slabosz, the founder of Zen Trading (The Art of Trading). ✍️📈
👉 My contribution and improvement was adding a divergence line directly on the RSI chart.
Why? Because most people can’t confirm correctness just by reading the code. 🧑💻❌
They need to see it with their own eyes 👀✔️ — this prevents misinterpretation and makes divergences crystal clear.
✨ By adding these visual confirmations, the efficiency and usability of the code has been significantly enhanced. 🚀📊

Liquidation Strategy📈 It enters a long trade when long liquidation spikes above a set threshold.
📉 It enters a short trade when short liquidation drops below the negative threshold.
🧮 It optionally filters entries using an EMA multiplier.
🔁 It exits long when RSI crosses below its smoothed version.
🔄 It exits short when RSI crosses above its smoothed version.
🔗 It requires linking to the Liquidations indicator on Bybit or OKX charts.

Chimera [theUltimator5]In myth, the chimera is an “impossible” hybrid—lion, goat, and serpent fused into one—striking to look at and formidable in presence. The word has come to mean a beautiful, improbable union of parts that shouldn’t work together, yet do.
Chimera is a dual-mode market context tool that blends a multi-input oscillator with classic ADX/DI trend strength, plus optional multi-timeframe “gap-line” tracking. Use it to visualize regime (trend vs. range), momentum swings around an adaptive midline, and higher timeframe (HTF) reference levels that auto-terminate on touch/cross.
Modes
1) Oscillator view
A smoothed composite of five common inputs—RSI, MACD (oscillator), Bollinger position, Stochastic, and an ATR/DI-weighted bias. Each is normalized to a comparable 0–100 style scale, averaged, and plotted as a candle-style oscillator (short vs. long smoothing, wickless for clarity). A dynamic midline with standard-deviation bands frames neutral → bearish/bullish zones. Colors ramp from neutral to your chosen Oversold/Overbought endpoints; consolidation can override to white.
Here is a description of the (5) signals used to calculate the sentiment oscillator:
RSI (14): Measures recent momentum by comparing average gains vs. losses. High = strength after advances; low = weakness after declines. (Z-score normalized to 0–100.)
MACD oscillator (12/26/9): Uses the difference between MACD and its signal (histogram) to gauge momentum shifts. Positive = bullish tilt; negative = bearish. (Z-score normalized.)
Bollinger Bands position (20, 2): Locates price within the bands (0–100 from lower → upper). Near upper suggests strength/expansion; near lower suggests weakness/contraction. (Then normalized.)
Stochastic (14, 3, 3): Shows where the close sits within the recent high-low range, smoothed via %D. Higher values = closes near highs; lower = near lows. (Scaled 0–100.)
ATR/DI composite (14): Volatility-weighted directional bias: (+DI − −DI) amplified by ATR as a % of price and its relative average. Positive = bullish pressure with volatility; negative = bearish. (Rank/scale normalized.)
All five are normalized and averaged into one composite, then smoothed (short/long) and compared to an adaptive midline with bands.
2) ADX view
Shows ADX, +DI, –DI with user-defined High Threshold. Transparency and color shift with regime. When ADX is strong, a directional “fire/ice” gradient fills the area between ADX and the high threshold, biased toward the dominant DI; when ADX is weak, a soft white fade highlights low-trend conditions.
HTF gap-line tracking (optional; both modes)
Detects “gap-like” reference levels after weak-trend consolidation flips into a sudden DI jump.
Anchors a line at the event bar’s open and auto-terminates upon first touch/cross (tick-size tolerance).
Auto-selects up to three higher timeframes suited to your chart resolution and prints non-overlapping lines with labels like 1H / 4H / 1D. Lower-priority duplicates are suppressed to reduce clutter.
Confirmation / repaint notes
Signals and lines finalize on bar close of the relevant timeframe.
HTF elements update only on the HTF bar close. During a forming bar they may appear transiently.
Line removal finalizes after the bar that produced the touch/cross closes.
Visual cues & effects
Oscillator candles: Open/High = long smoothing; Low/Close = short smoothing (no wicks).
Adaptive bands: Midline ± StdDev Multiplier × stdev of the blended series.
Consolidation tint: Optional white backdrop/candles when the consolidation condition is true (balance + low ADX).
Breakout VFX (optional): With strong DI/ADX and Bollinger breaks, renders a subtle “fire” flare above upper-band thrusts or “ice” shelf below lower-band thrusts.
Inputs (high-level)
Visual Style: Oscillator or ADX.
General (Oscillator): Lookback Period, Short/Long Smoothing, Standard Deviation Multiplier.
Color (Oscillator): Oversold/Overbought colors for gradient endpoints.
Plot (Oscillator): Show Candles, Show Slow MA Line, Show Individual Component (RSI/MACD/BB/Stoch/ATR).
Table (Oscillator): Show Information Table & position (compact dashboard of component values + status).
ADX / Gaps / VFX (both modes): ADX High Threshold, Highlight Backgrounds, Show Gap Labels, Visual Overlay Effects, and color choices for current-TF & HTF lines.
HTF selection: Automatic ladder (3 tiers) based on your chart timeframe.
Alerts (built-in)
Buy Signal – Primary: Oscillator exits oversold.
Sell Signal – Primary: Oscillator exits overbought.
Gap Fill Line Created (Any TF)
Gap Fill Line Terminated (Any TF)
ADX Crossed ABOVE/BELOW Low Threshold
ADX Crossed ABOVE/BELOW High Threshold
Consolidation Started
Alerts evaluate on the close of the relevant timeframe.
How to read it (quick guide)
Pick your lens: Oscillator for blended momentum around an adaptive midline; ADX for trend strength and DI skew.
Watch extremes & mean re-entries (Oscillator): Approaches to the top/bottom band show persistent momentum; returns toward the midline show normalization.
Check regime (ADX): Below Low = low-trend; above High = strong trend, with “fire/ice” bias toward +DI/–DI.
Track gap lines: Fresh labels mark new reference levels; lines auto-remove on first interaction. HTF lines add context but finalize only on HTF close.
The uniqueness from this indicator comes from multiple areas:
1. A unique multi-timeframe algorithm detects gap fill zones and plots them on the chart.
2. Visual effects for both visual modes were hand crafted to provide a visually stunning and intuitive interface.
3. The algorithm to determine sentiment uses a unique blend of weight and sensitivity adjustment to create a plot with elastic upper and lower bounds based off historical volatility and price action.

Information Flow Analysis[b🔄 Information Flow Analysis: Systematic Multi-Component Market Analysis Framework
SYSTEM OVERVIEW AND ANALYTICAL FOUNDATION
The Information Flow Kernel - Hybrid combines established technical analysis methods into a unified analytical framework. This indicator systematically processes three distinct data streams - directional price momentum, volume-weighted pressure dynamics, and intrabar development patterns - integrating them through weighted mathematical fusion to produce statistically normalized market flow measurements.
COMPREHENSIVE MATHEMATICAL FRAMEWORK
Component 1: Directional Flow Analysis
The directional component analyzes price momentum through three mathematical vectors:
Price Vector: p = C - O (intrabar directional bias)
Momentum Vector: m = C_t - C_{t-1} (bar-to-bar velocity)
Acceleration Vector: a = m_t - m_{t-1} (momentum rate of change)
Directional Signal Integration:
S_d = \text{sgn}(p) \cdot |p| + \text{sgn}(m) \cdot |m| \cdot 0.6 + \text{sgn}(a) \cdot |a| \cdot 0.3
The signum function preserves directional information while absolute values provide magnitude weighting. Coefficients create a hierarchy emphasizing intrabar movement (100%), momentum (60%), and acceleration (30%).
Final Directional Output: K_1 = S_d \cdot w_d where w_d is the directional weight parameter.
Component 2: Volume-Weighted Pressure Analysis
Volume Normalization: r_v = \frac{V_t}{\overline{V_n}} where \overline{V_n} represents the n-period simple moving average of volume.
Base Pressure Calculation: P_{base} = \Delta C \cdot r_v \cdot w_v where \Delta C = C_t - C_{t-1} and w_v is the velocity weighting factor.
Volume Confirmation Function:
f(r_v) = \begin{cases}
1.4 & \text{if } r_v > 1.2 \
0.7 & \text{if } r_v < 0.8 \
1.0 & \text{otherwise}
\end{cases}
Final Pressure Output: K_2 = P_{base} \cdot f(r_v)
Component 3: Intrabar Development Analysis
Bar Position Calculation: B = \frac{C - L}{H - L} when H - L > 0 , else B = 0.5
Development Signal Function:
S_{dev} = \begin{cases}
2(B - 0.5) & \text{if } B > 0.6 \text{ or } B < 0.4 \
0 & \text{if } 0.4 \leq B \leq 0.6
\end{cases}
Final Development Output: K_3 = S_{dev} \cdot 0.4
Master Integration and Statistical Normalization
Weighted Component Fusion: F_{raw} = 0.5K_1 + 0.35K_2 + 0.15K_3
Sensitivity Scaling: F_{master} = F_{raw} \cdot s where s is the sensitivity parameter.
Statistical Normalization Process:
Rolling Mean: \mu_F = \frac{1}{n}\sum_{i=0}^{n-1} F_{master,t-i}
Rolling Standard Deviation: \sigma_F = \sqrt{\frac{1}{n}\sum_{i=0}^{n-1} (F_{master,t-i} - \mu_F)^2}
Z-Score Computation: z = \frac{F_{master} - \mu_F}{\sigma_F}
Boundary Enforcement: z_{bounded} = \max(-3, \min(3, z))
Final Normalization: N = \frac{z_{bounded}}{3}
Flow Metrics Calculation:
Intensity: I = |z|
Strength Percentage: S = \min(100, I \times 33.33)
Extreme Detection: \text{Extreme} = I > 2.0
DETAILED INPUT PARAMETER SPECIFICATIONS
Sensitivity (0.1 - 3.0, Default: 1.0)
Global amplification multiplier applied to the master flow calculation. Functions as: F_{master} = F_{raw} \cdot s
Low Settings (0.1 - 0.5): Enhanced precision for subtle market movements. Optimal for low-volatility environments, scalping strategies, and early detection of minor directional shifts. Increases responsiveness but may amplify noise.
Moderate Settings (0.6 - 1.2): Balanced sensitivity for standard market conditions across multiple timeframes.
High Settings (1.3 - 3.0): Reduced sensitivity to minor fluctuations while emphasizing significant flow changes. Ideal for high-volatility assets, trending markets, and longer timeframes.
Directional Weighting (0.1 - 1.0, Default: 0.7)
Controls emphasis on price direction versus volume and positioning factors. Applied as: K_{1,weighted} = K_1 \times w_d
Lower Values (0.1 - 0.4): Reduces directional bias, favoring volume-confirmed moves. Optimal for ranging markets where momentum may generate false signals.
Higher Values (0.7 - 1.0): Amplifies directional signals from price vectors and acceleration. Ideal for trending conditions where directional momentum drives price action.
Velocity Weighting (0.1 - 1.0, Default: 0.6)
Scales volume-confirmed price change impact. Applied in: P_{base} = \Delta C \times r_v \times w_v
Lower Values (0.1 - 0.4): Dampens volume spike influence, focusing on sustained pressure patterns. Suitable for illiquid assets or news-sensitive markets.
Higher Values (0.8 - 1.0): Amplifies high-volume directional moves. Optimal for liquid markets where volume provides reliable confirmation.
Volume Length (3 - 20, Default: 5)
Defines lookback period for volume averaging: \overline{V_n} = \frac{1}{n}\sum_{i=0}^{n-1} V_{t-i}
Short Periods (3 - 7): Responsive to recent volume shifts, excellent for intraday analysis.
Long Periods (13 - 20): Smoother averaging, better for swing trading and higher timeframes.
DASHBOARD SYSTEM
Primary Flow Gauge
Bilaterally symmetric visualization displaying normalized flow direction and intensity:
Segment Calculation: n_{active} = \lfloor |N| \times 15 \rfloor
Left Fill: Bearish flow when N < -0.01
Right Fill: Bullish flow when N > 0.01
Neutral Display: Empty segments when |N| \leq 0.01
Visual Style Options:
Matrix: Digital blocks (▰/▱) for quantitative precision
Wave: Progressive patterns (▁▂▃▄▅▆▇█) showing flow buildup
Dots: LED-style indicators (●/○) with intensity scaling
Blocks: Modern squares (■/□) for professional appearance
Pulse: Progressive markers (⎯ to █) emphasizing intensity buildup
Flow Intensity Visualization
30-segment horizontal bar graph with mathematical fill logic:
Segment Fill: For i \in : filled if \frac{i}{29} \leq \frac{S}{100}
Color Coding System:
Orange (S > 66%): High intensity, strong directional conviction
Cyan (33% ≤ S ≤ 66%): Moderate intensity, developing bias
White (S < 33%): Low intensity, neutral conditions
Extreme Detection Indicators
Circular markers flanking the gauge with state-dependent illumination:
Activation: I > 2.0 \land |N| > 0.3
Bright Yellow: Active extreme conditions
Dim Yellow: Normal conditions
Metrics Display
Balance Value: Raw master flow output ( F_{master} ) showing absolute directional pressure
Z-Score Value: Statistical deviation ( z_{bounded} ) indicating historical context
Dynamic Narrative System
Context-sensitive interpretation based on mathematical thresholds:
Extreme Flow: I > 2.0 \land |N| > 0.6
Moderate Flow: 0.3 < |N| \leq 0.6
High Volatility: S > 50 \land |N| \leq 0.3
Neutral State: S \leq 50 \land |N| \leq 0.3
ALERT SYSTEM SPECIFICATIONS
Mathematical Trigger Conditions:
Extreme Bullish: I > 2.0 \land N > 0.6
Extreme Bearish: I > 2.0 \land N < -0.6
High Intensity: S > 80
Bullish Shift: N_t > 0.3 \land N_{t-1} \leq 0.3
Bearish Shift: N_t < -0.3 \land N_{t-1} \geq -0.3
TECHNICAL IMPLEMENTATION AND PERFORMANCE
Computational Architecture
The system employs efficient calculation methods minimizing processing overhead:
Single-pass mathematical operations for all components
Conditional visual rendering (executed only on final bar)
Optimized array operations using direct calculations
Real-Time Processing
The indicator updates continuously during bar formation, providing immediate feedback on changing market conditions. Statistical normalization ensures consistent interpretation across varying market regimes.
Market Applicability
Optimal performance in liquid markets with consistent volume patterns. May require parameter adjustment for:
Low-volume or after-hours sessions
News-driven market conditions
Highly volatile cryptocurrency markets
Ranging versus trending market environments
PRACTICAL APPLICATION FRAMEWORK
Market State Classification
This indicator functions as a comprehensive market condition assessment tool providing:
Trend Analysis: High intensity readings ( S > 66% ) with sustained directional bias indicate strong trending conditions suitable for momentum strategies.
Reversal Detection: Extreme readings ( I > 2.0 ) at key technical levels may signal potential trend exhaustion or reversal points.
Range Identification: Low intensity with neutral flow ( S < 33%, |N| < 0.3 ) suggests ranging market conditions suitable for mean reversion strategies.
Volatility Assessment: High intensity without clear directional bias indicates elevated volatility with conflicting pressures.
Integration with Trading Systems
The normalized output range facilitates integration with automated trading systems and position sizing algorithms. The statistical basis provides consistent interpretation across different market conditions and asset classes.
LIMITATIONS AND CONSIDERATIONS
This indicator combines established technical analysis methods and processes historical data without predicting future price movements. The system performs optimally in liquid markets with consistent volume patterns and may produce false signals in thin trading conditions or during news-driven market events. This indicator is provided for educational and analytical purposes only and does not constitute financial advice. Users should combine this analysis with proper risk management, position sizing, and additional confirmation methods before making any trading decisions. Past performance does not guarantee future results.
Note: The term "kernel" in this context refers to modular calculation components rather than mathematical kernel functions in the formal computational sense.
As quantitative analyst Ralph Vince noted: "The essence of successful trading lies not in predicting market direction, but in the systematic processing of market information and the disciplined management of probability distributions."
— Dskyz, Trade with insight. Trade with anticipation.

RSI Trend Navigator [QuantAlgo]🟢 Overview
The RSI Trend Navigator integrates RSI momentum calculations with adaptive exponential moving averages and ATR-based volatility bands to generate trend-following signals. The indicator applies variable smoothing coefficients based on RSI readings and incorporates normalized momentum adjustments to position a trend line that responds to both price action and underlying momentum conditions.
🟢 How It Works
The indicator begins by calculating and smoothing the RSI to reduce short-term fluctuations while preserving momentum information:
rsiValue = ta.rsi(source, rsiPeriod)
smoothedRSI = ta.ema(rsiValue, rsiSmoothing)
normalizedRSI = (smoothedRSI - 50) / 50
It then creates an adaptive smoothing coefficient that varies based on RSI positioning relative to the midpoint:
adaptiveAlpha = smoothedRSI > 50 ? 2.0 / (trendPeriod * 0.5 + 1) : 2.0 / (trendPeriod * 1.5 + 1)
This coefficient drives an adaptive trend calculation that responds more quickly when RSI indicates bullish momentum and more slowly during bearish conditions:
var float adaptiveTrend = source
adaptiveTrend := adaptiveAlpha * source + (1 - adaptiveAlpha) * nz(adaptiveTrend , source)
The normalized RSI values are converted into price-based adjustments using ATR for volatility scaling:
rsiAdjustment = normalizedRSI * ta.atr(14) * sensitivity
rsiTrendValue = adaptiveTrend + rsiAdjustment
ATR-based bands are constructed around this RSI-adjusted trend value to create dynamic boundaries that constrain trend line positioning:
atr = ta.atr(atrPeriod)
deviation = atr * atrMultiplier
upperBound = rsiTrendValue + deviation
lowerBound = rsiTrendValue - deviation
The trend line positioning uses these band constraints to determine its final value:
if upperBound < trendLine
trendLine := upperBound
if lowerBound > trendLine
trendLine := lowerBound
Signal generation occurs through directional comparison of the trend line against its previous value to establish bullish and bearish states:
trendUp = trendLine > trendLine
trendDown = trendLine < trendLine
if trendUp
isBullish := true
isBearish := false
else if trendDown
isBullish := false
isBearish := true
The final output colors the trend line green during bullish states and red during bearish states, creating visual buy/long and sell/short opportunity signals based on the combined RSI momentum and volatility-adjusted trend positioning.
🟢 Signal Interpretation
Rising Trend Line (Green): Indicates upward momentum where RSI influence and adaptive smoothing favor continued price advancement = Potential buy/long positions
Declining Trend Line (Red): Indicates downward momentum where RSI influence and adaptive smoothing favor continued price decline = Potential sell/short positions
Flattening Trend Lines: Occur when momentum weakens and the trend line slope approaches neutral, suggesting potential consolidation before the next move
Built-in Alert System: Automated notifications trigger when bullish or bearish states change, sending "RSI Trend Bullish Signal" or "RSI Trend Bearish Signal" messages for timely entry/exit
Color Bar Candles Option: Optional candle coloring feature that applies the same green/red trend colors to price bars, providing additional visual confirmation of the current trend direction

WaveTrend OscillatorWave trend Oscillator, similar to the other Cypher Oscillators, just that this oscillator is a little bit more refined less noise and a few better options for the money flow, but keeping the basic Structures and features. The only feature this does not have is the divergences

LRSlope - Linear Regression SlopeThis indicator attempts to predict the direction of the trend using least squares moving averages (LSMA).
The indicator's core purpose is to determine whether the price trajectory has a positive or negative slope and calculate directional changes. It also measures the strength of price momentum by calculating how strongly the slope.
The indicator calculates the slope of the curve for each bar and the EMA of these slopes for the specified period (Curve Length). It is consists of a histogram and two lines named "Average Slope"(white line) and "Simple" (green line).
The "Average Slope" is the simple moving average of the calculated EMA values.
" Simple " is SMA of calculated slopes.
The color of the histogram changes depending on the relative position of these two lines and zero line.
Simply put, the green bars of the histogram indicate an uptrend, blue bars indicate a horizontal or reverse movement, and red bars indicate a downtrend.
It is possible to see the strength of the momentum by the amount of change in the " Simple" (green line).

Supertrend Channel Histogram OscillatorThis histogram is based on the script "Supertrend Channels "
The idea of the indicator is to visually represent the interaction of price with several different supertrend channels of various lengths in an oscillator in order to make it much more clear to the trader how the longer trends are interacting with shorter trends of the price movement of an asset. I got this idea from the "Kurutoga Cloud" and "Kurutoga Histogram" by D7R which is based on the centerlines of 3 Donchian Channels, however after I started using the Supertrend Channel by LuxAlgo I found that it was a more reliable price range channel than a standard Donchian Channel and I made this indicator to accompany it.
This indicator plots a positive value above 0 when the price is above the centerline of the supertrend channel and a negative value below 0 when the price is below the centerline.
The first supertrend's length and multiple can be adjusted in the settings.
The given supertrend input is then doubled and quadrupled in both length and multiplication so that a supertrend histogram with the values of 3, 3 will be accompanied by 2 additional supertrend histograms with the values of 6, 6 and 12, 12.
The larger price trend histograms are clearly visible behind the short term supertrend channel's histogram, giving traders a balanced view of short and long term trends interacting. The less visible columns of the larger trend remain above or below the 0 line behind the more visible short term channel trend, helping to spot pullbacks within a larger trend.
Additionally, when the 3 separate histograms are all positive or all negative but the histogram columns are separating from each other this can indicate a potential trend exhaustion leading to reversal or pullback about to happen.
The overbought and oversold lines at 50 and -50 are representative primarily of the short term trend with above 50 or below -50 indicating that the price is pushing the boundary and potentially beginning a new short term supertrend in the opposite direction. If values do not noticably exceed these levels, then the current short term trend movement can be viewed as a pullback within a larger trend, with continuation potentially to follow.
I have had troubles converting the original code to v6 so this will be published here in v5 of pinescript to be used in conjunction with the original. I was intending to create a companion indicator for this oscillator that represents 3 supertrends with corresponding 2x and 4x calculations based on LuxAlgo's script, but I can't seem to get it to work correctly in v5.
For best visualization of the trends 3 LuxAlgo Supertrend channels with 2x and 4x values should be used in conjunction with each other to fully visualize the histogram.
Used in conjunction with other indicators this can be a very effective strategy to capture larger trend moves and pullbacks within trends, as well as warn of potential price trend exhaustion.