Peak Rejection LevelsPeak Rejection Levels is a price-action–based indicator designed to automatically identify strong rejection levels at swing highs and swing lows.
It highlights areas where price attempted to move further but was firmly rejected, often acting as key support or resistance zones.
The indicator is especially useful for :
Intraday and swing trading
Identifying high-probability rejection zones
Support/resistance mapping based on pure price action
Confluence with trend, structure, or indicator-based strategies
📈 What Is a “Peak Rejection”?
A peak rejection is defined using strict price-action rules:
🔺 Swing High Rejection (Resistance)
A swing high is marked as a rejection when:
The candle is a confirmed swing high
The candle has an upper wick
The upper wick is larger than the candle body
The wick represents the highest price of the swing
This indicates strong selling pressure and rejection from higher prices
🔻 Swing Low Rejection (Support)
A swing low is marked as a rejection when:
The candle is a confirmed swing low
The candle has a lower wick
The lower wick is larger than the candle body
The wick represents the lowest price of the swing
This indicates strong buying pressure and rejection from lower prices
When these conditions are met, the indicator draws a horizontal level at the rejection wick.
🧠 Key Features
✅ Works on any timeframe
✅ Non-repainting (uses confirmed swings)
✅ Automatically removes broken levels
✅ Automatically removes old levels based on time
✅ Clean and uncluttered chart output
✅ Pure price-action logic (no indicators, no lag)
Rejection

TXG Wick DetectorOverview The TradeX Guru Wick Detector is a price action utility designed to automatically identify potential "Liquidity Grabs" and "Stop Hunts." It highlights candles where the market has aggressively rejected lower prices, signaling that Smart Money may be absorbing sell orders (the "Samosa Crust Break").
How It Works This script calculates the ratio of the lower wick relative to the total candle range.
If the lower wick represents more than 50% of the total candle size (customizable), a Teal Diamond (💎) is plotted below the bar.
This visual cue alerts you to a strong rejection of lower prices, often found at the end of a correction or during a "Stop Hunt" at key support levels.
Features
Automated Detection: Instantly spots high-rejection candles across any timeframe.
Customizable Sensitivity: Adjust the "Wick %" threshold in the settings to filter for stronger or weaker signals.
Visual Clarity: Non-intrusive diamond markers that do not clutter your chart.
Watermark: Includes the TradeX Guru brand mark for easy sharing.
🚀 How to Use This Tool for Analysis
Do not trade every diamond blindly. Use this 3-Step "Pro" Protocol to filter for high-probability setups:
1. Location (Context is King) Only consider signals that appear at Key Areas of Value:
Support Zones: Is price testing a historical support line?
Round Numbers: Is the signal near a psychological level (e.g., Nifty 25,000, BankNifty 50,000)?
High Volume Nodes (VPVR): Is price rejecting a high-volume cluster?
Rule: If a diamond appears in the middle of a random trend ("No Man's Land"), ignore it.
2. The Trap (The Hunt)
Watch for price to dip below your key level first.
The appearance of the Teal Diamond confirms that this dip was rejected. This suggests that "Stop Loss Liquidity" was hunted and absorbed by institutional buyers.
3. The Trigger (Entry & Risk)
Entry: Wait for the diamond candle to close. Enter on the next candle if bullish momentum continues.
Stop Loss: Place your SL strictly below the Low of the diamond candle.
Logic: If price breaks below the wick, the rejection has failed, and the setup is invalid.
Settings Guide
Wick Size % (Default 0.50): The wick must be 50% of the candle.
Increase to 0.60 for fewer, higher-quality signals.
Decrease to 0.40 for more frequent signals (scalping).
Disclaimer This tool is for educational purposes only. Price action patterns do not guarantee future performance. Always manage your risk.

Rejection Block StrategiyaRejection Block Strategy. This indicator draws rejection blocks on the chart based on the strategy explained by VerumTrader. You can use the default settings or change the settings.

VSA - Absorption - Bookmap
- Backtest on Gold, ES, major forex (liquid instruments where VSA works best).
- Filter with trend (EMA 50/200) or session (London/NY open).
- Combine with your Bookmap: use Pine signal → confirm with absorption/iceberg + delta flip.
- Risk: 0.5–1.5% per trade, 1:3+ R:R.

Smarter Money Volume Rejection Blocks [PhenLabs]📊 Smarter Money Volume Rejection Blocks – Institutional Rejection Zone Detection
The Smarter Money Volume Rejection Blocks indicator combines high-volume analysis with statistical confidence intervals to identify where institutional traders are actively defending price levels through volume spikes and rejection patterns.
🔥 Core Methodology
Volume Spike Detection analyzes when current volume exceeds moving average by configurable multipliers (1.0-5.0x) to identify institutional activity
Rejection Candle Analysis uses dual-ratio system measuring wick percentage (30-90%) and maximum body ratio (10-60%) to confirm genuine rejections
Statistical Confidence Channels create three-level zones (upper, center, lower) based on ATR or Standard Deviation calculations
Smart Invalidation Logic automatically clears zones when price significantly breaches confidence levels to maintain relevance
Dynamic Channel Projection extends confidence intervals forward up to 200 bars with customizable length
Support Zone Identification detects bullish rejections where smart money absorbs selling pressure with high volume and strong lower wicks
Resistance Zone Mapping identifies bearish rejections where institutions defend price levels with volume spikes and pronounced upper wicks
Visual Information Dashboard displays real-time status table showing volume spike conditions and active support/resistance zones
⚙️ Technical Configuration
Dual Confidence Interval Methods: Choose between ATR-Based for trend-following environments or StdDev-Based for range-bound statistical precision
Volume Moving Average: Configurable period (default 20) for baseline volume comparison calculations
Volume Spike Multiplier: Adjustable threshold from 1.0 to 5.0 times average volume to filter institutional activity
Rejection Wick Percentage: Set minimum wick size from 30% to 90% of candle range for valid rejection detection
Maximum Body Ratio: Configure body-to-range ratio from 10% to 60% to ensure genuine rejection structures
Confidence Multiplier: Statistical multiplier (default 1.96) for 95% confidence interval calculations
Channel Projection Length: Extend confidence zones forward from 10 to 200 bars for anticipatory analysis
ATR Period: Customize Average True Range lookback from 5 to 50 bars for volatility-based calculations
StdDev Period: Adjust Standard Deviation period from 10 to 100 bars for statistical precision
🎯 Real-World Trading Applications
Identify high-probability support zones where institutional buyers have historically defended price with significant volume
Map resistance levels where smart money sellers consistently reject higher prices with volume confirmation
Combine with price action analysis to confirm breakout validity when price approaches confidence channel boundaries
Use invalidation signals to exit positions when smart money zones are definitively breached
Monitor the real-time dashboard to quickly assess current market structure and active rejection zones
Adapt strategy based on calculation method: ATR for trending markets, StdDev for ranging conditions
Set alerts on confidence level breaches to catch potential trend reversals or continuation patterns
📈 Visual Interpretation Guide
Green Zones indicate bullish rejection blocks where buyers defended with high volume and lower wicks
Red Zones indicate bearish rejection blocks where sellers defended with high volume and upper wicks
Solid Center Lines represent the core rejection price level where maximum volume activity occurred
Dashed Confidence Boundaries show upper and lower statistical limits based on volatility calculations
Zone Opacity decreases as channels extend forward to indicate decreasing confidence over time
Dashboard Color Coding provides instant visual feedback on active volume spike and zone conditions
⚠️ Important Considerations
Volume-based indicators identify historical rejection zones but cannot predict future price action with certainty
Market conditions change rapidly and institutional activity patterns evolve continuously
High volume does not guarantee level defense as market structure can shift without warning
Confidence intervals represent statistical probabilities, not guaranteed price boundaries

Triangle Reversal IndicatorTriangle Reversal Indicator – A Visual Tool for Identifying Reversal Patterns
This indicator is designed to highlight potential trend reversal moments by comparing the current candle with the previous one. It offers a unique approach by focusing on distinct candle patterns rather than generic trend indicators, making it a valuable addition to your trading toolkit.
How It Works:
For a bullish signal, the indicator checks if:
The current candle is bullish (closing higher than it opens) while the previous candle was bearish.
The current candle’s low breaches the previous bearish candle’s low.
The current candle’s close is above the previous bearish candle’s close.
When these conditions are met, a tiny green triangle is plotted below the candle to signal a potential bullish reversal.
Conversely, for a bearish signal, it verifies if:
The current candle is bearish (closing lower than it opens) following a bullish candle.
The current candle’s high exceeds the previous bullish candle’s high.
The current candle’s close falls below the previous bullish candle’s close.
If all conditions are satisfied, a small red triangle appears above the candle to indicate a potential bearish reversal.
How to Use:
Simply apply the indicator on your chart and look for the tiny triangles that appear above or below the candles. These markers can serve as an additional visual cue when confirming entry or exit points, but it’s best used alongside your other analysis techniques.
Customization Options:
Users can further enhance the script by adding inputs for lookback periods, adjusting the triangle size, or modifying colors to match their chart themes.

Volumetric Rejection Blocks [UAlgo]The Volumetric Rejection Blocks is designed to help traders identify and visualize key price levels where volumetric rejections occur, which may indicate a shift in market sentiment. These rejections can signal potential trend reversals or areas where price action is likely to face support or resistance. By drawing rejection blocks based on volumetric strength, the indicator allows users to observe where significant buying or selling pressure has been exerted, which can be used as a reference point for future price action.
Also indicator dynamically calculates swing highs and lows, analyzes bullish and bearish strengths based on volume-weighted price movements, and displays rejection blocks on the chart. Each rejection block represents an area where the price attempted to move beyond a certain level but faced rejection, either on a close or wick basis. This can be particularly useful for traders who rely on market structure and order flow to make informed decisions about entering or exiting trades.
🔶 Key Features
Swing Length Customization: Allows users to define the swing length, helping tailor the sensitivity of the swing high and low detection to the specific market conditions.
Rejection Block Visualization: Displays up to the last 10 rejection blocks based on user settings, clearly marking areas of significant bullish or bearish rejections.
Volumetric Strength Analysis: The indicator calculates bullish and bearish strength for each rejection block, based on volume-weighted price movements over the last few bars, giving insight into the intensity of the rejection.
Violation Check Type: Offers two options for violation detection—"Close" and "Wick". This allows traders to specify whether a price level is considered broken only if it closes beyond the level or if any wick breaches it.
Bullish and Bearish Block Coloring: Rejection blocks are colored to represent bullish (green) and bearish (red) rejection areas. The color transparency can be adjusted for clear visibility overlaid on the price chart.
Market Structure Labels: Labels and lines marking "Market Structure Shift" (MSS) and "Break of Structure" (BOS) are displayed, giving traders context about significant market structure changes.
🔶 Interpreting the Indicator
Rejection Blocks: These colored blocks on the chart indicate areas where the price faced significant buying or selling pressure. A green block suggests a bullish rejection (support zone), where buyers absorbed the sell-off, potentially pushing the price upward. Conversely, a red block indicates a bearish rejection (resistance zone), where sellers overpowered buyers, potentially driving the price lower.
Strength Analysis: The width of the green and red sections within a rejection block represents the relative bullish and bearish strengths. A wider green section indicates stronger bullish support, while a wider red section suggests more robust bearish resistance. This helps traders gauge the likelihood of price holding or breaching these levels.
Market Structure Shift (MSS) and Break of Structure (BOS): The indicator automatically detects and labels significant changes in market structure. An "MSS" label indicates the first break, suggesting a potential shift in trend direction. A "BOS" label indicates a subsequent confirmation in trend direction, allowing traders to recognize potential trend continuations.
Violation Check: Traders can choose how to interpret breaks of these rejection blocks. Using the "Close" option provides a more conservative approach, requiring a close beyond the level for confirmation. The "Wick" option is more aggressive, treating any wick beyond the level as a break.
🔶 Disclaimer
Use with Caution: This indicator is provided for educational and informational purposes only and should not be considered as financial advice. Users should exercise caution and perform their own analysis before making trading decisions based on the indicator's signals.
Not Financial Advice: The information provided by this indicator does not constitute financial advice, and the creator (UAlgo) shall not be held responsible for any trading losses incurred as a result of using this indicator.
Backtesting Recommended: Traders are encouraged to backtest the indicator thoroughly on historical data before using it in live trading to assess its performance and suitability for their trading strategies.
Risk Management: Trading involves inherent risks, and users should implement proper risk management strategies, including but not limited to stop-loss orders and position sizing, to mitigate potential losses.
No Guarantees: The accuracy and reliability of the indicator's signals cannot be guaranteed, as they are based on historical price data and past performance may not be indicative of future results.

Inverse FVG with Rejections [TFO]This indicator is made to look for Inverse Fair Value Gaps (IFVGs) and show rejections from relevant areas. Fair Value Gaps (FVGs) are created when there is an energetic move that leaves a gap between the preceding and following candle's wicks. When that area is violated, we may consider that area as an Inverse FVG, treating it along the lines of a "support turned resistance" type setup with proper context.
Once a Fair Value Gap (FVG) is found with sufficient user-defined displacement, it is saved until price fully closes through that area, at which point it becomes an IFVG, which is also saved until price once again closes through that area.
Users can select a specific time period from which to look for and save FVGs, such as during the New York trading session in the following example.
Lastly, users can enable rejections that look for swing lows in bullish FVGs/IFVGs and swing highs in bearish FVGs/IFVGs. The following picture shows an instance of rejections from both regular and inverse FVGs, meaning the pivots were formed in a mutually shared area between a FVG and IFVG.

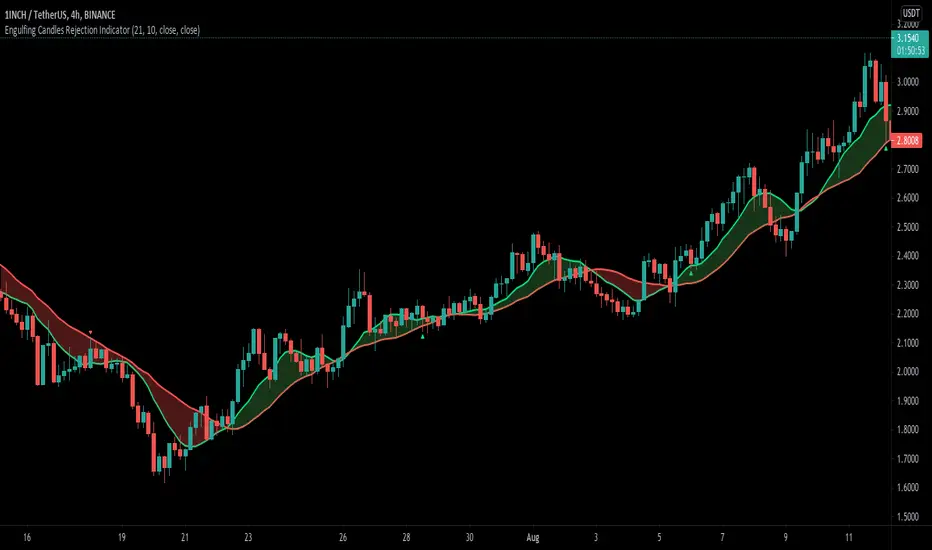
Engulfing Candle Rejection IndicatorThis indicator allows you to filter noisy chart, with engulfing candles which have been rejected from current trend lines. Trend lines by default are 21 MA (fast) and 10 MA (slow one). If fast moving average is greater than slower one, automatically indicator would represent that like uptrend, and if opposite then like a downtrend.
Consider to work only on higher time frames like 1H and higher, so you really can find only best entries.
Have fun, best wishes!
Pinbar-Rejection-IndicatorThis indicator allows you to filter noisy pin bar chart, with pin bars which have been rejected from dynamic support/resistance level also named as 21 Moving Average.
I would consider to work only on higher time frames like 1H and higher, so you really can find only best entries.
Have fun, write your feedback in the comments section:)
P.S This is the first version of the indicator, so be free to contribute, and soon I'm going to improve this indicator.
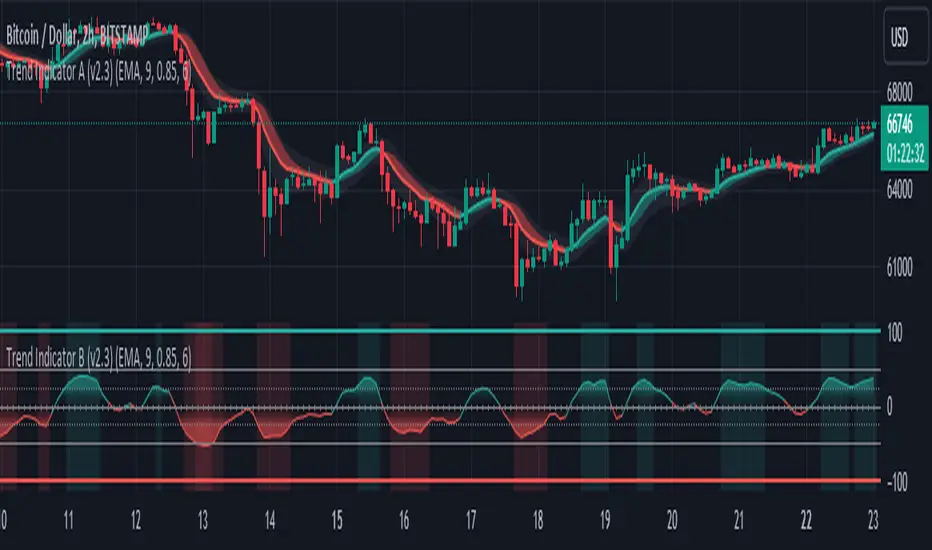
Trend Indicator B-V2 (Momentum measuring)"Trend Indicator A-V2" and "Trend Indicator B-V2" are updated and improved versions of my initial trend indicators. Totally rethinking the code, adding highs and lows in the calculations, including some more customisation through colour schemes.
In practice, this indicator uses EMAs and Heikin Ashi to provide an overall idea of the trend.
The "Trend Indicator A-V2" is an overlay showing “Smoothed Heikin Ashi” .
The "Trend Indicator B-V2" uses the same values in a different way to measure the momentum of the trend and identify potential trend rejections.
Please, take into account that it is a lagging indicator.
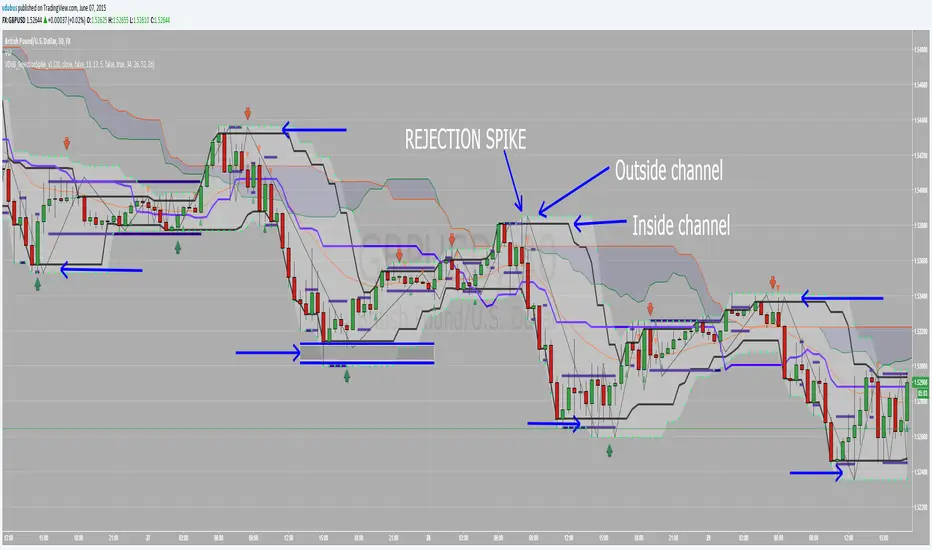
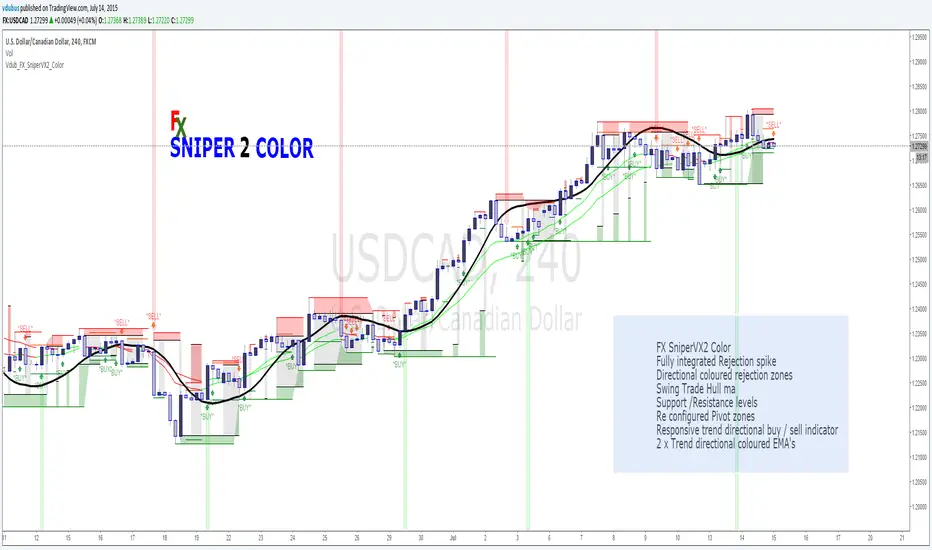
Vdub FX SniperVX2 Color v2FX SniperVX2 Color
Fully integrated Rejection spike
Directional coloured rejection zones
Swing Trade Hull ma
Support /Resistance levels
Re configured Pivot zones
Responsive trend directional buy / sell indicator
2 x Trend directional coloured EMA's
Sniper series
VDUB_RejectionSpike_v1 this indicator is for use with the Rejection Spike Strategy I recently publish
Have't had chance to test it yet so feel free to try.
Details of the strategy are listed in the link below