MACD+EMA crossovers Strategy customIt is a Strategy to use EMA crossover and MACD to decide when "buy" and when "sell", the key is spend some time "tuning" the parameters and using the simulation tool to find the best parameters for EMA and MACD there are 6 parameters, but with Excel and patience you could find the best configuration for the past and apply it to the future and see.
ابحث في النصوص البرمجية عن "macd"

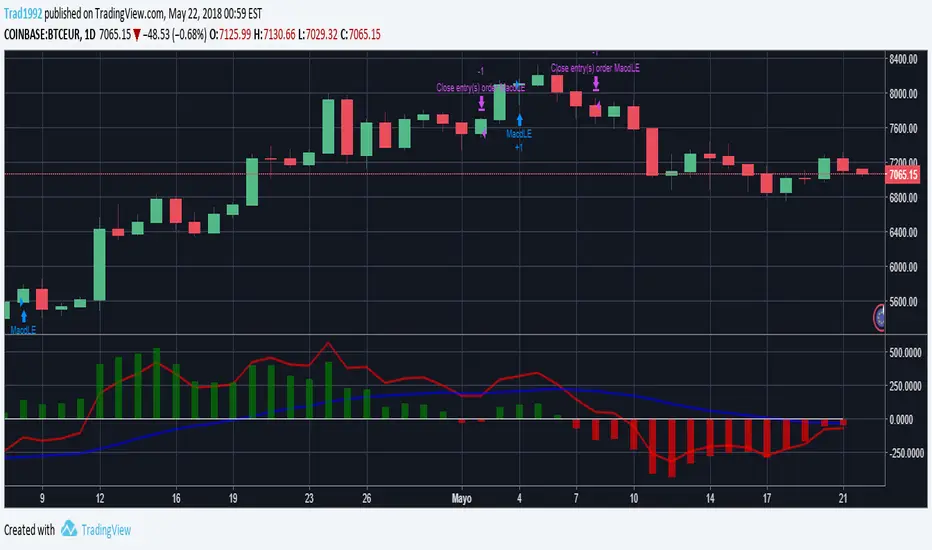
MACD Strategy custom for cryptosIt is a MACD with strategy simulation implemented to "tune" the MACD parameters for cryptos, it only use long and close strategy, not short

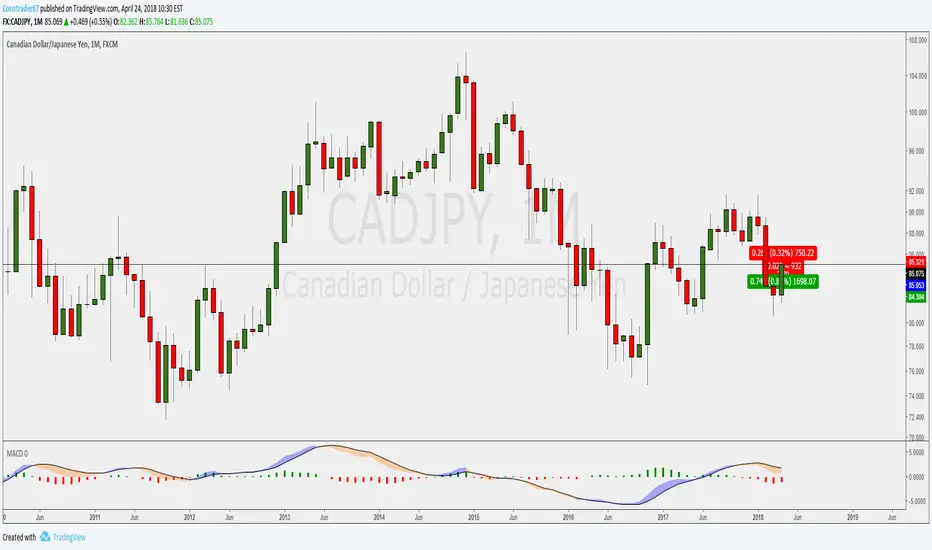
Explosive PotentialThis script looks at times where MACD is within a specified range (very close to 0 values) and price action is very constrained (under 2%). Historically price has made a strong move after these conditions.
I typically run this on an 8H timeframe.
Review on BTCUSD and other cryptos.

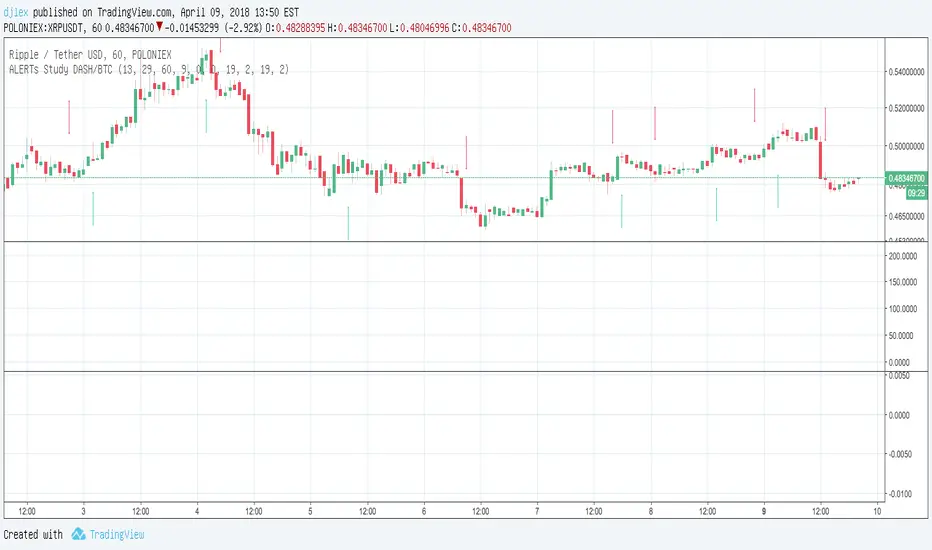
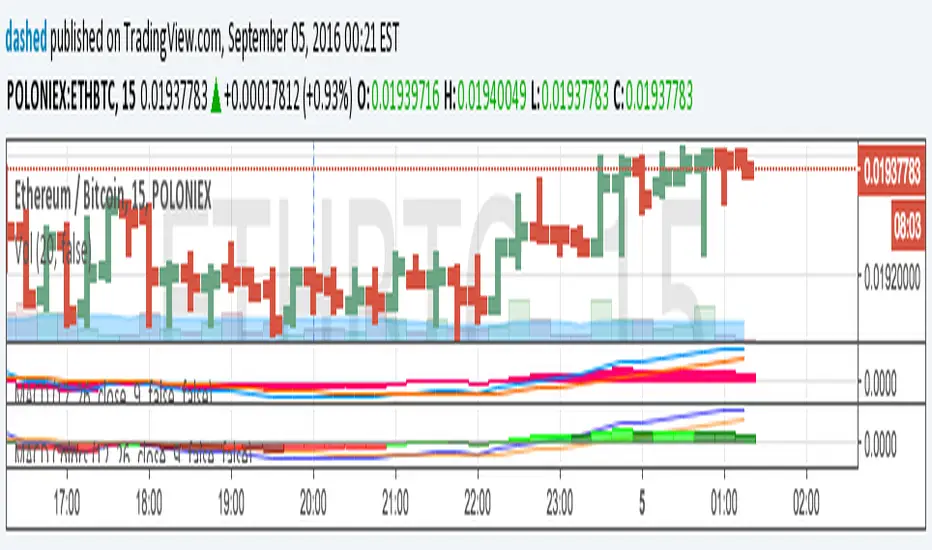
MACD Study DASH/BTC 3H ALERTS for AutoviewAutoview qualified Study Script Alerts for Autoview
Please Set Up Alert 1x Bars Close
For Margin Trading (Poloniex)
ULTIMATE PINE INJECTOR V1.2 INSERT
MACD Created by user ChrisMoody
NO REPAINT
With Stopp Loss and Trailing Stopp and Backtest
Now is for Free for all !

MACD Cross GridShow across all timeframes (15 minute to 1 week) whether MACD has crossed up (blue) or down (orange).

MACD 4H by mattzabWarning: This may repaint. For use with the 1D view only!
4 Hour MACD view with color coded histogram area.

MACD 1D by mattzab1 Day Standard MACD with a filled in Histogram (area) with color coding to show Histogram direction.


MACD ColorsThis adds visual cue for when MACD histogram bars is decreasing when above the zero-line, and increasing when below the zero-line.
Based on:
SMACDGraphs slope of ohlc4 MACD
When it =0, trend change
play with slow&fast lengths as well as the length used to calculate the slope.
-in progress(?)
Vertical lines in the image are as close as I could get them to SMACD=0.

7M Multi-Factor Momentum ScoreboardThe 7M Scoreboard is more than just a collection of indicators; it is a Real-Time Scoring Engine designed for momentum traders and quant-focused analysts. While many scripts simply "mash up" indicators, the 7M Dashboard provides a weighted analytical framework that filters market noise into a single, actionable 7M Score.
It evaluates seven distinct dimensions of market health: Price Action, Relative Volume (Time-specific and Daily), Capital Structure (Float), and Multi-timeframe Trend alignment (VWAP, VWMA, MACD).
Make sure to enable Extended Trading Hours in the TradingView settings.
What makes it original?
The core innovation lies in the 7M Scoring & Alerting logic. Instead of a trader manually checking eight different parameters, the script performs a logical "Pass/Fail" assessment on every bar.
Dynamic Time-Anchored Change: Unlike standard change percentages, this script allows you to anchor the "Starting Price" to the Pre-market (4:00 AM), Regular Open (9:30 AM), or Post-market (4:00 PM).
Relative Volume (RVOL) at Time: It compares the current 5-minute volume not just to recent bars, but to the historical average for that specific time of day, filtering out the standard "lunchtime lull."
Capital Structure Integration: It incorporates a "Float" filter, essential for identifying low-float momentum vs. heavy-cap institutional moves.
How it works
The script calculates a total score out of 9 points based on the following criteria:
Momentum: Is price change > X percent from your chosen time anchor?
Liquidity: Is the 5-minute volume > X million?
Relative Strength: Is Daily RVOL and Time-specific RVOL > X?
Trend Alignment: Is price above VWAP and the 20-period VWMA?
Momentum Convergence: Is the MACD histogram positive?
Volatility Health: Is RSI between 30 and 70 (avoiding extreme over-extension)?
Step-by-Step Guide to Use
Set your Market Type: Open the settings and choose your Price Change Anchor.
Use Pre-Market if you trade the morning "Gap and Go."
Use Regular Open if you are a day-trader focused on the 9:30 AM bell.
Configure Thresholds: Set your Min % Move (e.g., 1.5%) and Min 5m Vol.
Monitor the 7M Score: Look at the bottom row.
Score < 5: High-risk, no clear momentum.
Score 7+: High-probability "7M Pass" setup.
Alerts (Great with TV's Watchlist Alerts)
Right-click the chart and "Add Alert." Select the 7M Dashboard and choose the "🚀 7M PASS" condition to be notified the moment a ticker hits your momentum criteria.
Recommended Settings for Different Assets
Small-Cap Momentum Pre-Market - 4.0% (Change) - 500k (5m Vol) - 50M (Float)
Mega-Cap / Tech Regular - 1.0% (Change) - 1.5M (5m Vol) - 30,000M (Float)
Crypto Intraday Regular - 2.5% (Change) - 1M (5m Vol) - 10,000M (Foat)
Technical Details
Pine Script Version: v6
Visuals: Features a high-contrast UI with adaptive text sizing for the final 7M Score.
Alerting: Includes an optimized alert() function for real-time momentum detection.
Disclaimer
The "7M Multi-Factor Momentum Scoreboard" is a technical analysis tool provided for educational and informational purposes only. Nothing contained in this script, its outputs, or the 7M Score constitutes financial, investment, or trading advice. Trading stocks, futures, and cryptocurrencies involves significant risk of loss and is not suitable for every investor.
No Guarantees: Past performance as displayed by historical indicators is not indicative of future results.
Model Limitations: The 7M Score is based on mathematical calculations of price and volume; it does not account for fundamental news, earnings surprises, or broader macroeconomic shifts.
Personal Responsibility: You are solely responsible for your own trading decisions. Always perform your own due diligence and consult with a licensed financial advisor before putting capital at risk.

Presets Selector - FRIDAY NIGHT CHALLENGEBonjour/Salut ça va?
Ok enough for the french :) You guys should really stop challenging me on things on Pinescript and asking me if it's possible or not because... that's the second time in a row I'm about to reveal a nice trick
Please take this example as a proof of concept/feasability. This follower said "I'm tired of manually filling the fields of my indicator, my fingers are dead.... every time I change something in the code, I lose the configuration by default"
Say no more sir.... challenge accep..... wait for it ....ted (that's his real name actually) !!!!
Mesdames et messieurs (damn... my french accent is back), let's unveil the curtain on... the PRESETS SELECTOR (please try to imagine someone super famous shouting it and everyone standing and clapping their hands...)
What I mean by presets is THIS
I inspired myself from this script MacD-Custom-Indicator-Multiple-Time-Frame-All-Available-Options/ (this guy has more likes in a single indicator than me and my friends and my family in all social media channels combined over the past 15 years or so....#humbled)
Anywoo.... the concept is that you can define presets in your script .... which is not possible by TradingView at the moment. If you always have the same set of parameters for a given indicator, please think about your fingers too and give them some rest by implementing a preset in the code directly
I also added a few features :
- You can choose the resolution of the indicator (from 1 minute to 1 month)
- You can choose also between displaying a MACD or a MACD ZERO LAG
Imagine now you have a super complex backtest with hundreds of fields... and unfortunately ... you'll have to fill some of them for each of your tests. Might change in the future if TradingView will add the feature though :)
PS
I'm writing the Algorithm Builder documentation this weekend and the website should open in 3 weeks maximum. I think it's one of the most beautiful trading websites I've seen ever (I didn't do it, my friend did but who cares... it's mine :p)
PS2
I didn't post yesterday the script of the day so I'll post it tomorrow. What is due is due and I won't fail my challenge even ONCE !!!! ("But you just did yesterday bro...")
Have a great weekend
Dave
____________________________________________________________
Be sure to hit the thumbs up
- If you want to suggest some indicators that I can develop and share with the community, please use my personal TRELLO board
- I'm an officially approved PineEditor/LUA/MT4 approved mentor on codementor. You can request a coaching with me if you want and I'll teach you how to build kick-ass indicators and strategies
Jump on a 1 to 1 coaching with me
- You can also hire for a custom dev of your indicator/strategy/bot/chrome extension/python

MACDouble + RSI (rec. 15min-2hr intrv) Uses two sets of MACD plus an RSI to either long or short. All three indicators trigger buy/sell as one (ie it's not 'IF MACD1 OR MACD2 OR RSI > 1 = buy", its more like "IF 1 AND 2 AND RSI=buy", all 3 match required for trigger)
The MACD inputs should be tweaked depending on timeframe and what you are trading. If you are doing 1, 3, 5 min or real frequent trading then 21/44/20 and 32/66/29 or other high value MACDs should be considered. If you are doing longer intervals like 2, 3, 4hr then consider 9/19/9 and 21/44/20 for MACDs (experiment! I picked these example #s randomly).
Ideal usage for the MACD sets is to have MACD2 inputs at around 1.5x, 2x, or 3x MACD1's inputs.
Other settings to consider: try having fastlength1=macdlength1 and then (fastlength2 = macdlength2 - 2). Like 10/26/10 and 23/48/20. This seems to increase net profit since it is more likely to trigger before major price moves, but may decrease profitable trade %. Conversely, consider FL1=MCDL1 and FL2 = MCDL2 + (FL2 * 0.5). Example: 10/26/10 and 22/48/30 this can increase profitable trade %, though may cost some net profit.
Feel free to message me with suggestions or questions.

K's Reversal Indicator IK's reversal indicator I is a special combination between Bollinger bands and the MACD oscillator. It is a contrarian indicator that depends on the following conditions:
• A buy signal is generated whenever the current market price is below the 100-period lower Bollinger band while simultaneously, the MACD value must be above its signal line. At the same time, the previous MACD value must be below its previous signal line.
• A sell (short) signal is generated whenever the current market price is above the 100-period upper Bollinger band while simultaneously, the MACD value must be below its signal line. At the same time, the previous MACD value must be above its previous signal line.
The way to use K's reversal indicator is to combine it with your already long/short bias in a sideways/range market in order to maximize the probability of success.
Limitations of the indicator include the following:
• There are no clear exit rules that work well on average across the markets. Even though K’s reversal indicator gives contrarian signals, it does not show when to exit the positions.
• As with other indicators, it underperforms on some markets and is not to be used everywhere.
• False signals tend to occur during trending markets but there is no proven way to detect a false signal.

McClellan Oscillator [CC]The McClellan Oscillator was created by Sherman and Marian McClellan and it is essentially a MACD of the advancing and declining symbols of the day and is best used as a comparison with the biggest stocks such as my example Apple but that is just my opinion. I pulled the symbol names from a Trading View blog so I'm not 100% sure if they are accurate so please let me know if I'm wrong. Buy when the indicator is over 0 and sell when it falls below 0 but keep in mind that these values are for the market itself and not the individual symbol.
This was a special request so let me know if you would like me to publish more scripts or if you want something custom done!
Note: I'm republishing this because the original script couldn't be found in searches so this will fix that.

jaems_Combo: StochRSI + MACD + ADX [QuantDev]//@version=6
strategy("jaems_Combo: StochRSI + MACD + ADX ", overlay=false, initial_capital=10000, currency=currency.USD, commission_type=strategy.commission.percent, commission_value=0.05, slippage=1)
// ==========================================
// 1. 사용자 입력 (User Inputs)
// ==========================================
//
grp_time = "Backtest Period"
useDateFilter = input.bool(true, "기간 필터 적용", group=grp_time)
startDate = input.time(timestamp("2023-01-01 00:00"), "시작일", group=grp_time)
endDate = input.time(timestamp("2099-12-31 23:59"), "종료일", group=grp_time)
inDateRange = not useDateFilter or (time >= startDate and time <= endDate)
//
grp_stoch = "1. Stochastic RSI Settings"
stoch_len = input.int(14, "RSI Length", group=grp_stoch)
stoch_k = input.int(3, "K", group=grp_stoch)
stoch_d = input.int(3, "D", group=grp_stoch)
rsi_len = input.int(14, "Stochastic Length", group=grp_stoch)
//
grp_macd = "2. MACD Settings (Normalized)"
macd_fast = input.int(12, "Fast Length", group=grp_macd)
macd_slow = input.int(26, "Slow Length", group=grp_macd)
macd_sig = input.int(9, "Signal Length", group=grp_macd)
macd_norm_len = input.int(100, "Normalization Lookback", group=grp_macd)
//
grp_adx = "3. ADX Settings"
adx_len = input.int(14, "ADX Smoothing", group=grp_adx)
di_len = input.int(14, "DI Length", group=grp_adx)
adx_thresh = input.int(25, "ADX Threshold", group=grp_adx)
//
grp_risk = "4. Risk Management"
stopLossPct = input.float(2.0, "손절매 (Stop Loss %)", step=0.1, group=grp_risk) / 100
takeProfitPct = input.float(4.0, "익절매 (Take Profit %)", step=0.1, group=grp_risk) / 100
// - 신규 추가 (Alert Configuration)
grp_alert = "5. Alert Configuration"
msg_long_entry = input.string("Long Entry Triggered", "Long 진입 메시지", group=grp_alert)
msg_short_entry = input.string("Short Entry Triggered", "Short 진입 메시지", group=grp_alert)
msg_long_exit = input.string("Long Position Closed", "Long 청산 메시지", group=grp_alert)
msg_short_exit = input.string("Short Position Closed", "Short 청산 메시지", group=grp_alert)
// ==========================================
// 2. 데이터 처리 및 지표 계산
// ==========================================
// Stoch RSI
rsi_val = ta.rsi(close, rsi_len)
k = ta.sma(ta.stoch(rsi_val, rsi_val, rsi_val, stoch_len), stoch_k)
d = ta.sma(k, stoch_d)
// ADX
= ta.dmi(di_len, adx_len)
// Normalized MACD (0~100 Scale)
= ta.macd(close, macd_fast, macd_slow, macd_sig)
highest_macd = ta.highest(macd_line, macd_norm_len)
lowest_macd = ta.lowest(macd_line, macd_norm_len)
// 분모가 0이 되는 예외 처리
denom = (highest_macd - lowest_macd)
norm_macd = denom != 0 ? (macd_line - lowest_macd) / denom * 100 : 50
norm_signal = denom != 0 ? (macd_signal - lowest_macd) / denom * 100 : 50
// ==========================================
// 3. 시각화 (Dark Mode Optimized Colors)
// ==========================================
color gridColor = color.new(#787B86, 50)
hline(0, "Bottom", color=gridColor)
hline(50, "Middle", color=gridColor, linestyle=hline.style_dotted)
hline(100, "Top", color=gridColor)
plot(k, "Stoch K", color=color.new(#00E5FF, 0), linewidth=1) // Neon Cyan
plot(d, "Stoch D", color=color.new(#EA00FF, 0), linewidth=1) // Neon Magenta
plot(adx, "ADX", color=color.new(#FFEB3B, 0), linewidth=2)
hline(adx_thresh, "ADX Threshold", color=color.new(#FFEB3B, 50), linestyle=hline.style_dashed)
plot(norm_macd, "Norm MACD", color=color.new(#76FF03, 60), style=plot.style_area)
plot(norm_signal, "Norm Signal", color=color.new(#FF1744, 20), linewidth=1)
// ==========================================
// 4. 전략 로직 (Strategy Logic) - 요청하신 내용으로 전면 수정
// ==========================================
// 조건: K가 D보다 크고(AND) K가 Norm Signal보다 큰 상태
bool is_bullish = (k > d) and (k > norm_signal)
// 조건: K가 D보다 작고(AND) K가 Norm Signal보다 작은 상태
bool is_bearish = (k < d) and (k < norm_signal)
// 진입 신호: "이전 봉에는 아니었는데, 지금 봉에서 두 조건을 동시에 만족했을 때" (돌파 순간)
longCondition = is_bullish and not is_bullish
shortCondition = is_bearish and not is_bearish
// 주문 실행 (Confirmed Bar Only) + Alert Message 연결
if inDateRange and barstate.isconfirmed
if longCondition
strategy.entry("Long", strategy.long, alert_message=msg_long_entry)
if shortCondition
strategy.entry("Short", strategy.short, alert_message=msg_short_entry)
// ==========================================
// 5. 청산 및 신호 강조 (Alert Message 추가)
// ==========================================
if strategy.position_size > 0
strategy.exit("Long Exit", "Long", stop=strategy.position_avg_price * (1 - stopLossPct), limit=strategy.position_avg_price * (1 + takeProfitPct), alert_message=msg_long_exit)
if strategy.position_size < 0
strategy.exit("Short Exit", "Short", stop=strategy.position_avg_price * (1 + stopLossPct), limit=strategy.position_avg_price * (1 - takeProfitPct), alert_message=msg_short_exit)
// 배경 신호
bgcolor(longCondition ? color.new(#76FF03, 90) : na, title="Long Signal BG")
bgcolor(shortCondition ? color.new(#FF1744, 90) : na, title="Short Signal BG")

Trend Deviation strategy - BTC [IkkeOmar]Intro:
This is an example if anyone needs a push to get started with making strategies in pine script. This is an example on BTC, obviously it isn't a good strategy, and I wouldn't share my own good strategies because of alpha decay.
This strategy integrates several technical indicators to determine market trends and potential trade setups. These indicators include:
Directional Movement Index (DMI)
Bollinger Bands (BB)
Schaff Trend Cycle (STC)
Moving Average Convergence Divergence (MACD)
Momentum Indicator
Aroon Indicator
Supertrend Indicator
Relative Strength Index (RSI)
Exponential Moving Average (EMA)
Volume Weighted Average Price (VWAP)
It's crucial for you guys to understand the strengths and weaknesses of each indicator and identify synergies between them to improve the strategy's effectiveness.
Indicator Settings:
DMI (Directional Movement Index):
Length: This parameter determines the number of bars used in calculating the DMI. A higher length may provide smoother results but might lag behind the actual price action.
Bollinger Bands:
Length: This parameter specifies the number of bars used to calculate the moving average for the Bollinger Bands. A longer length results in a smoother average but might lag behind the price action.
Multiplier: The multiplier determines the width of the Bollinger Bands. It scales the standard deviation of the price data. A higher multiplier leads to wider bands, indicating increased volatility, while a lower multiplier results in narrower bands, suggesting decreased volatility.
Schaff Trend Cycle (STC):
Length: This parameter defines the length of the STC calculation. A longer length may result in smoother but slower-moving signals.
Fast Length: Specifies the length of the fast moving average component in the STC calculation.
Slow Length: Specifies the length of the slow moving average component in the STC calculation.
MACD (Moving Average Convergence Divergence):
Fast Length: Determines the number of bars used to calculate the fast EMA (Exponential Moving Average) in the MACD.
Slow Length: Specifies the number of bars used to calculate the slow EMA in the MACD.
Signal Length: Defines the number of bars used to calculate the signal line, which is typically an EMA of the MACD line.
Momentum Indicator:
Length: This parameter sets the number of bars over which momentum is calculated. A longer length may provide smoother momentum readings but might lag behind significant price changes.
Aroon Indicator:
Length: Specifies the number of bars over which the Aroon indicator calculates its values. A longer length may result in smoother Aroon readings but might lag behind significant market movements.
Supertrend Indicator:
Trendline Length: Determines the length of the period used in the Supertrend calculation. A longer length results in a smoother trendline but might lag behind recent price changes.
Trendline Factor: Specifies the multiplier used in calculating the trendline. It affects the sensitivity of the indicator to price changes.
RSI (Relative Strength Index):
Length: This parameter sets the number of bars over which RSI calculates its values. A longer length may result in smoother RSI readings but might lag behind significant price changes.
EMA (Exponential Moving Average):
Fast EMA: Specifies the number of bars used to calculate the fast EMA. A shorter period results in a more responsive EMA to recent price changes.
Slow EMA: Determines the number of bars used to calculate the slow EMA. A longer period results in a smoother EMA but might lag behind recent price changes.
VWAP (Volume Weighted Average Price):
Default settings are typically used for VWAP calculations, which consider the volume traded at each price level over a specific period. This indicator provides insights into the average price weighted by trading volume.
backtest range and rules:
You can specify the start date for backtesting purposes.
You can can select the desired trade direction: Long, Short, or Both.
Entry and Exit Conditions:
LONG:
DMI Cross Up: The Directional Movement Index (DMI) indicates a bullish trend when the positive directional movement (+DI) crosses above the negative directional movement (-DI).
Bollinger Bands (BB): The price is below the upper Bollinger Band, indicating a potential reversal from the upper band.
Momentum Indicator: Momentum is positive, suggesting increasing buying pressure.
MACD (Moving Average Convergence Divergence): The MACD line is above the signal line, indicating bullish momentum.
Supertrend Indicator: The Supertrend indicator signals an uptrend.
Schaff Trend Cycle (STC): The STC indicates a bullish trend.
Aroon Indicator: The Aroon indicator signals a bullish trend or crossover.
When all these conditions are met simultaneously, the strategy considers it a favorable opportunity to enter a long trade.
SHORT:
DMI Cross Down: The Directional Movement Index (DMI) indicates a bearish trend when the negative directional movement (-DI) crosses above the positive directional movement (+DI).
Bollinger Bands (BB): The price is above the lower Bollinger Band, suggesting a potential reversal from the lower band.
Momentum Indicator: Momentum is negative, indicating increasing selling pressure.
MACD (Moving Average Convergence Divergence): The MACD line is below the signal line, signaling bearish momentum.
Supertrend Indicator: The Supertrend indicator signals a downtrend.
Schaff Trend Cycle (STC): The STC indicates a bearish trend.
Aroon Indicator: The Aroon indicator signals a bearish trend or crossover.
When all these conditions align, the strategy considers it an opportune moment to enter a short trade.
Disclaimer:
THIS ISN'T AN OPTIMAL STRATEGY AT ALL! It was just an old project from when I started learning pine script!
The backtest doesn't promise the same results in the future, always do both in-sample and out-of-sample testing when backtesting a strategy. And make sure you forward test it as well before implementing it!
Furthermore this strategy uses both trend and mean-reversion systems, that is usually a no-go if you want to build robust trend systems .
Don't hesitate to comment if you have any questions or if you have some good notes for a beginner.

REMS Synergy OverlayThis 3rd generation REMS indicator builds upon the foundations assessing the relationships between RSI, EMAs, MACDs, and Stochastic RSI across multiple timeframes. Designed to help traders identify less frequent, but high probability entries across 2 time frames. Uses 3 levels of confluence indicators for both long and short moves.
Confluence Level 1 (Highest Conviction):
Evaluates selected criteria across both timeframes. All selected criteria must be in confluence to trigger signal.
Confluence Level 2 (Moderate Conviction):
Selected criteria can be selected by each timeframe individually. All selected criteria must be in confluence to trigger signal.
Confluence Level 3 (Lower/supportive confluence):
Of the selected criteria, this level can evaluate a set number of conditions that must be met. Number of conditions is user-defined.
Includes VWAP and 4 EMAs as optional visual representations.
Includes 'Enhanced Candles' than can colour code candlesticks for better visual identification. (off by default)
Originally designed with 5 minute and 2 minute timeframes in mind, and pairs well with REMS First Strike and/or REMS Snap Shot indicators.
Values coded below:
RSI
-Primary: Length = 14, Smoothing = 20 (via SMA)
-Secondary: Length = 7, Smoothing = 20 (via SMA)
Stochastic RSI
Primary:
-RSI Length = 14
-Stochastic Length = 8
-%K = 3, %D = 3
Secondary:
-RSI Length = 7
-Stochastic Length = 7
-%K = 3, %D = 2
MACD - applied to both timeframes
-Fast = 12, Slow = 26, Signal = 9

Adaptive Multi-TF Indicator Table with Presets giua64📌 Script Name:
Adaptive Multi-Timeframe Indicator Table with Presets — giua64
📄 Description:
This script displays an adaptive multi-timeframe dashboard that summarizes the signals of three key technical indicators:
Moving Averages (MAs), Relative Strength Index (RSI), and MACD.
It provides a fast and visually intuitive overview of market conditions across five timeframes (5m, 15m, 30m, 1h, 4h), helping traders quickly identify potential directional biases (e.g., bullish, bearish, or neutral) based on either predefined presets or fully manual settings.
🧰 Preset Configurations:
You can choose between four trading styles, each with optimized indicator parameters:
Scalping
• MAs: 5 / 10 (Fast), 20 / 50 (Slow)
• RSI: 7 periods | Overbought: 70 | Oversold: 30
• MACD: 5 / 13 | Signal: 3
Intraday
• MAs: 9 / 21 (Fast), 50 / 100 (Slow)
• RSI: 14 periods | Overbought: 60 | Oversold: 40
• MACD: 12 / 26 | Signal: 9
Swing
• MAs: 10 / 20 (Fast), 50 / 200 (Slow)
• RSI: 14 periods | Overbought: 65 | Oversold: 35
• MACD: 12 / 26 | Signal: 9
Manual
• Full custom control over all indicator settings.
🛠️ All settings can be customized manually from the options panel, including the exact MA periods, RSI thresholds, and MACD structure.
🧠 How It Works:
For each timeframe, the script evaluates:
MA crossover status (two levels):
The first symbol refers to the crossover of the fast MAs
The second symbol refers to the crossover of the slow MAs
🟢 = Bullish crossover
🔴 = Bearish crossover
➖ = Flat or no clear signal
RSI Direction:
↑ = RSI above upper threshold (potential overbought)
↓ = RSI below lower threshold (potential oversold)
→ = RSI in neutral range
MACD Line vs Signal Line:
↑ = MACD line is above signal line (bullish)
↓ = MACD line is below signal line (bearish)
→ = Flat or neutral signal
Each signal is assigned a numerical score. These are aggregated per timeframe to compute a combined score that reflects the directional bias for that specific time window.
🧠 Adaptive Logic by Asset:
This script is designed to be universally compatible across all asset types — including forex, crypto, stocks, indices, and commodities.
Thanks to its multi-timeframe nature and flexible indicator presets, the script automatically adjusts its behavior based on the asset selected, ensuring relevant analysis without requiring manual recalibration.
🧾 Summary Table Output:
At the bottom of the dashboard, a combined sentiment is displayed for:
3TF → 5m, 15m, 30m
4TF → Adds 1h
5TF → Adds 4h
Each row shows:
Signal → LONG / SHORT / NEUTRAL
Confidence (%) → Based on score aggregation and signal consistency
📌 Customization Options:
Table Position: Left, Right, or Center
Text Size: Small, Normal, or Large
Full Manual Configuration: All MA, RSI, and MACD parameters can be adjusted as needed
⚠️ Disclaimer:
This script is for educational and analytical purposes only.
It does not constitute financial advice or guarantee any trading results.
Always do your own research and apply responsible risk management.
