Trend Rainbow Moving Averages [TradeMaster Lite]The Trend Rainbow indicator is a simple technical analysis tool that uses moving averages to identify trends and potential buy and sell signals. It utilizes simple visualization techniques to present trend information in an intuitive, easily interpretable manner. This 21st-century tool is tailored for the modern trader who values both precision and simplicity.
The indicator uses our unique TRMA method to define short-term, intermediate, and long-term market trends. The TRMA (Trend Rainbow Moving Averages) is our own invention: a complex but flexible moving average matrix calculation that is designed to measure market trend direction, strength and shifting. Traders have the flexibility to choose from four types of moving average calculation bases to create a "rainbow".
👉 Example of usage:
General trend direction of the asset can be identified by looking at the slope of the rainbow. If the rainbow is generally pointing up, the asset is in an uptrend, if it is pointing down, the asset is in a downtrend. The indicator can also be used to assess the strength of a trend, identify potential resistance and support levels, and manage risk.
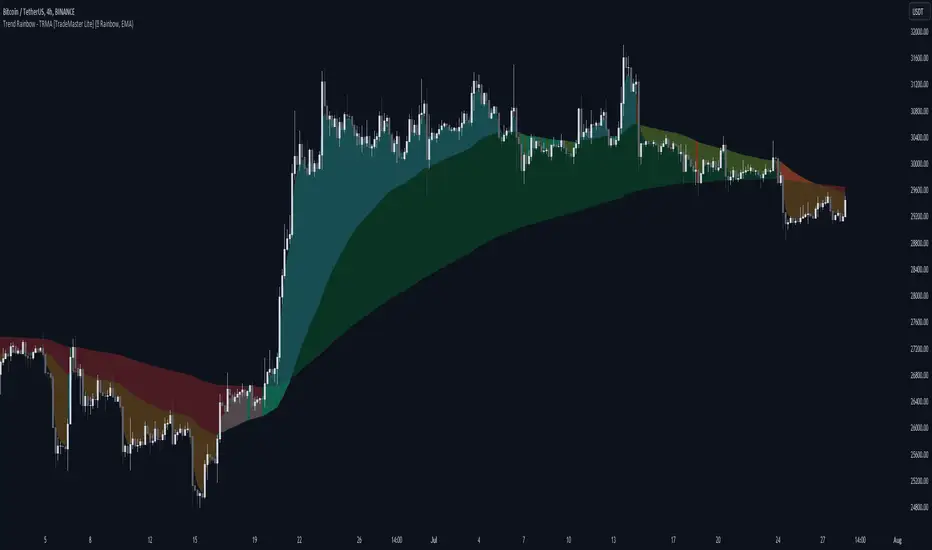
The Lite version of the indicator has 2 main trends to help you assess information about the direction and strength of asset's trend:
Intermediate trend: teal for bull trend, orange for bear trend.
Long-term trend: green for bull trend, red for bear trend.
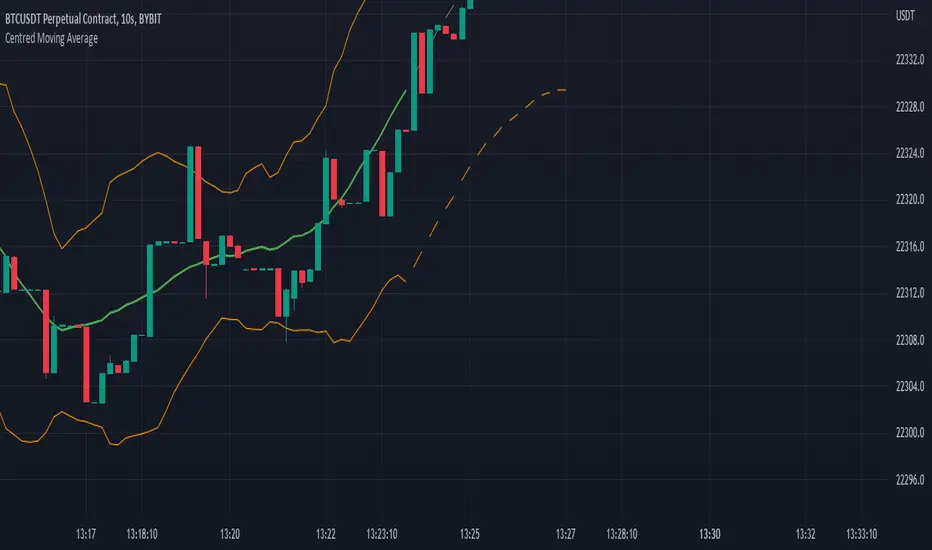
Left side:
The image clearly shows that during the decline, the bearish intermediate trend was tested multiple times, acting as a resistance. This is a sign of weakness in the intermediate trend. The price did not have enough strength test the long-term trend yet, which is a sign that the long-term trend is still bearish.
Right side:
The intermediate trend first turned into neutral, then bullish. This is a sign of strength in the short-term and medium-term trends. This strength did not weaken and eventually. By maintaining the bullish intermediate trend, the long term trend was able to turn bullish again and a strong uptrend is now unfolding. This is a sign that the long-term trend is changing to bullish.
The Trend Rainbow also helps in risk management. On the right side of the chart the price is making a very steep move and both the intermediate and long-term trends are very far away from the current price. This shows us potential risk and the possibility of a deeper pullback. Trend edges can be used as potential entries or targets, depending on the situation.
👉 General advice
Confirming Signals with other indicators:
As with all technical indicators, it is important to confirm potential signals with other analytical tools, such as support and resistance levels, as well as indicators like RSI, MACD, and volume. This helps increase the probability of a successful trade.
Use proper risk management:
When using this or any other indicator, it is crucial to have proper risk management in place. Consider implementing stop-loss levels and thoughtful position sizing.
Combining with other technical indicators:
The indicator can be effectively used alongside other technical indicators to create a comprehensive trading strategy and provide additional confirmation.
Keep in Mind:
Remember that the example presented highlights how the Trend Rainbow indicator can be used. However, like all indicators, it is not a definitive market predictor. Thorough research and backtesting are essential before making any trading decisions. Furthermore, it's crucial to have a solid understanding of the indicator and its behavior. Additionally, incorporating fundamental analysis and considering market sentiment can be vital factors to take into account in your trading approach.
Limitations:
The indicators within the TradeMaster Lite package aim for simplicity and efficiency, while retaining their original purpose and value. Some settings, functions or visuals may be simpler than expected.
⭐ Conclusion
We hold the view that the true path to success is the synergy between the trader and the tool, contrary to the common belief that the tool itself is the sole determinant of profitability. The actual scenario is more nuanced than such an oversimplification. Our aim is to offer useful features that meet the needs of the 21st century and that we actually use.
🛑 Risk Notice:
Everything provided by trademasterindicator – from scripts, tools, and articles to educational materials – is intended solely for educational and informational purposes. Past performance does not assure future returns.
Sma
20/200MAs+LTF+4HTF and HighLowBox+3HTF20/200MAs
Shows 20 and 200 MAs in each TFs(tfChart,1 Lower and 4 Higher).
TFs:
current TF
Lower TF (default: lower1)
Higher TF1 (default: higher1)
Higher TF2 (default: higher1)
Higher TF3 (default: higher1)
Higher TF4 (default: higher1)
MAs:
20MA (default: sma)
1st 200MA (default: sma)
2nd 200MA (default: ema)
VWAP (optional)
HighLowBox+3HTF
Enclose in a square high and low range in each timeframe.
Shows price range and duration of each box.
In current timeframe, shows Fibonacci Scale inside(23.6%, 38.2%, 50.0%, 61.8%, 76.4%)/outside of each box.
Outside(161.8%,261.8,361.8%) would be shown as next target, if break top/bottom of each box.
1st box for current timeframe.
2nd box for higher timeframe.(default: higher1)
3rd box for higher timeframe.(default: higher2)
4th box for higher timeframe.(default: higher3)
static timeframes can also be used.

Breadth - % Above * MA█ OVERVIEW
'Breadth - % Above * MA' is a script developed to measure market breadth, providing traders with a deeper understanding of the overall health of a chosen stock market or specific sector. By calculating the percentage of stocks performing above their Simple Moving Average (SMA), it offers an efficient and precise method to gauge market trends.
█ MARKET BREADTH
Market breadth is a powerful tool in technical analysis. It examines the number of securities on an upward trajectory versus those on a downward one. This indicator serves as a measure of market sentiment and assists in identifying the strength and sustainability of market trends.
█ PERCENTAGE ABOVE MOVING AVERAGE
The script's primary function is to show the percentage of stocks trading above a selected SMA. This provides valuable insight into the market's condition. For instance, a high percentage of stocks above their 200-day moving average may suggest a strong bull market. Conversely, a low percentage could indicate a bearish market. However, these are mere observations and should be supplemented with additional analysis for informed trading decisions.
█ KEY FEATURES
The script offers extensive customization. Users can choose from various stock market groups and SMA periods. The options for data smoothing and chart visualization enhance the versatility of the script.
The script also offers a choice of different candlestick styles for visualizing price movements. An added feature colors the inside bars in Heikin-Ashi (HA) format black, providing additional clarity.
█ ACKNOWLEDGEMENTS
The script incorporates code from the 'Line Break' script by kitoboynaya. We gratefully acknowledge their contribution.
█ CODE
The script is published as a protected code due to the usage of a certain style/formula. While the idea of knowledge sharing is encouraged, certain aspects of the script remain confidential.

SMA mechanical swing tradeIndicator that compares the closing price of an asset vs a simple moving average as a mechanical swing trading strategy. It allows the user to set any asset and timeframe for the strategy, which can be different from those the user is currently viewing. The strategy also allows the user to set an upside and downside tolerance so that retests within a few % of the SMA get some space to breathe before flipping directional bias.
If the selected asset in the strategy is different from the one currently viewed, the indicator plots the MA for the currently viewed asset but keeps applying the directional bias colors from the strategy asset.
Some examples of recommended usage of this indicator: BTCUSD 120D, BTCUSD 120D applied on ETHUSD, AAVEUSD 365D.

Ultimate Balance OscillatorIntroducing the Ultimate Balance Oscillator: A Powerful Trading Indicator
Built upon the renowned Rate of Change (ROC), Relative Strength Index (RSI), Commodity Channel Index (CCI), Williams Percent Range, and Average Directional Index (ADX) from TradingView, this indicator equips traders with an unparalleled understanding of market dynamics.
What sets the Ultimate Balance Oscillator apart is its meticulous approach to weighting. Each component is assigned a weight that reflects its individual significance, while carefully mitigating the influence of highly correlated signals. This strategic weighting methodology ensures an unbiased and comprehensive representation of market sentiment, eliminating dominance by any single indicator.
Key Features and Benefits:
1. Comprehensive Market Analysis: The Ultimate Balance Oscillator provides a comprehensive view of market conditions, enabling traders to discern price trends, evaluate momentum shifts, identify overbought or oversold levels, and gauge the strength of prevailing trends. This holistic perspective empowers traders to make well-informed decisions based on a thorough understanding of the market.
2. Enhanced Signal Accuracy: With its refined weighting approach, the Ultimate Balance Oscillator filters out noise and emphasizes the most relevant information. This results in heightened signal accuracy, providing traders with a distinct advantage in identifying optimal entry and exit points. Say goodbye to unreliable signals and welcome a more precise and dependable trading experience.
3. Adaptability to Various Trading Scenarios: The Ultimate Balance Oscillator transcends the constraints of specific markets or timeframes. It seamlessly adapts to diverse trading scenarios, accommodating both short-term trades and long-term investments. Traders can customize this indicator to suit their preferred trading style and effortlessly navigate ever-changing market conditions.
4. Simplicity and Ease of Use: The Ultimate Balance Oscillator simplifies trading analysis by providing a single line on the chart. Its straightforward interpretation and seamless integration into trading strategies make decision-making effortless. By observing bullish or bearish crossovers with the moving average, recognizing overbought or oversold levels, and tracking the overall trend of the oscillator, traders can make well-informed decisions with confidence.
5. Real-time Alerts: Stay ahead of the game with the Ultimate Balance Oscillator's customizable alert system. Traders can set up personalized alerts for bullish or bearish crossovers, breaches of overbought or oversold thresholds, or any specific events that align with their trading strategy. Real-time notifications enable timely action, ensuring traders never miss lucrative trading opportunities.
The Ultimate Balance Oscillator is a robust trading companion, empowering traders to make shrewd and calculated decisions. Embrace its power and elevate your trading endeavors to new heights of precision and success. Discover the potential of the Ultimate Balance Oscillator and unlock a world of trading possibilities.

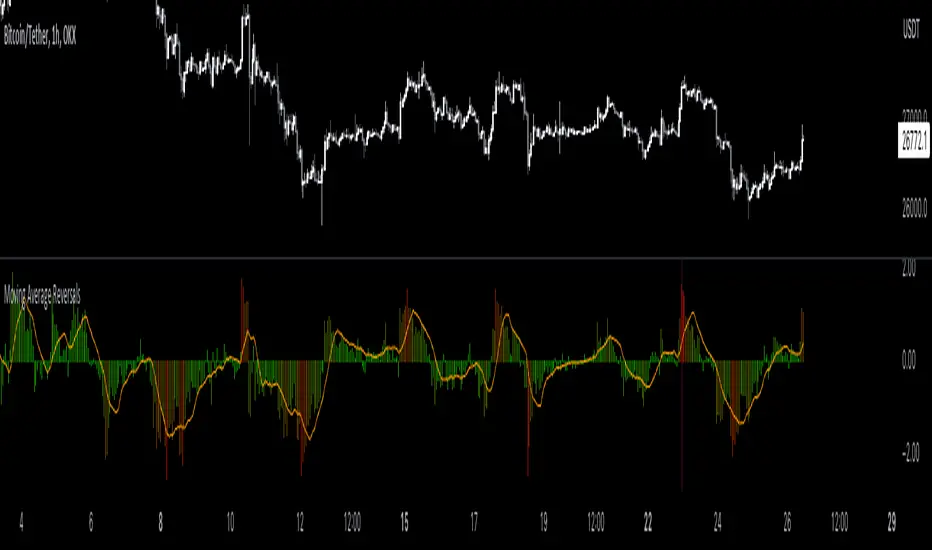
Moving Average Reversals [QuantVue]Moving Average Reversals
Description:
The Moving Average Reversals indicator gives a quick visual representation of when a stock gets extended up or down from a user selected moving average.
The color of the histogram dynamically changes as price becomes extended or within it’s normal trading range.
The indicator also highlights the largest extensions over the past year or 252 bars if using intraday.
Lastly a simple moving average of the extensions is calculated and used to confirm a change of character.
Settings:
🔹Use different MA types - EMA, SMA, HMA, WMA, VWMA
🔹Adjustable MA length
🔹Change distance measurement source - open, close, high, low, hl2, hlc3, ohlc4, hlcc4
🔹Extension highlighting
🔹Toggle MA extensions
Don't hesitate to reach out with any questions or concerns. We hope you enjoy!
Cheers.
Volatility SpeedometerThe Volatility Speedometer indicator provides a visual representation of the rate of change of volatility in the market. It helps traders identify periods of high or low volatility and potential trading opportunities. The indicator consists of a histogram that depicts the volatility speed and an average line that smoothes out the volatility changes.
The histogram displayed by the Volatility Speedometer represents the rate of change of volatility. Positive values indicate an increase in volatility, while negative values indicate a decrease. The height of the histogram bars represents the magnitude of the volatility change. A higher histogram bar suggests a more significant change in volatility.
Additionally, the Volatility Speedometer includes a customizable average line that smoothes out the volatility changes over the specified lookback period. This average line helps traders identify the overall trend of volatility and its direction.
To enhance the interpretation of the Volatility Speedometer, color zones are used to indicate different levels of volatility speed. These color zones are based on predefined threshold levels. For example, green may represent high volatility speed, yellow for moderate speed, and fuchsia for low speed. Traders can customize these threshold levels based on their preference and trading strategy.
By monitoring the Volatility Speedometer, traders can gain insights into changes in market volatility and adjust their trading strategies accordingly. For example, during periods of high volatility speed, traders may consider employing strategies that capitalize on price swings, while during low volatility speed, they may opt for strategies that focus on range-bound price action.
Adjusting the inputs of the Volatility Speedometer indicator can provide valuable insights and flexibility to traders. By modifying the inputs, traders can customize the indicator to suit their specific trading style and preferences.
One input that can be adjusted is the "Lookback Period." This parameter determines the number of periods considered when calculating the rate of change of volatility. Increasing the lookback period can provide a broader perspective of volatility changes over a longer time frame. This can be beneficial for swing traders or those focusing on longer-term trends. On the other hand, reducing the lookback period can provide more responsiveness to recent volatility changes, making it suitable for day traders or those looking for short-term opportunities.
Another adjustable input is the "Volatility Measure." In the provided code, the Average True Range (ATR) is used as the volatility measure. However, traders can choose other volatility indicators such as Bollinger Bands, Standard Deviation, or custom volatility measures. By experimenting with different volatility measures, traders can gain a deeper understanding of market dynamics and select the indicator that best aligns with their trading strategy.
Additionally, the "Thresholds" inputs allow traders to define specific levels of volatility speed that are considered significant. Modifying these thresholds enables traders to adapt the indicator to different market conditions and their risk tolerance. For instance, increasing the thresholds may highlight periods of extreme volatility and help identify potential breakout opportunities, while lowering the thresholds may focus on more moderate volatility shifts suitable for range trading or trend-following strategies.
Remember, it is essential to combine the Volatility Speedometer with other technical analysis tools and indicators to make informed trading decisions.

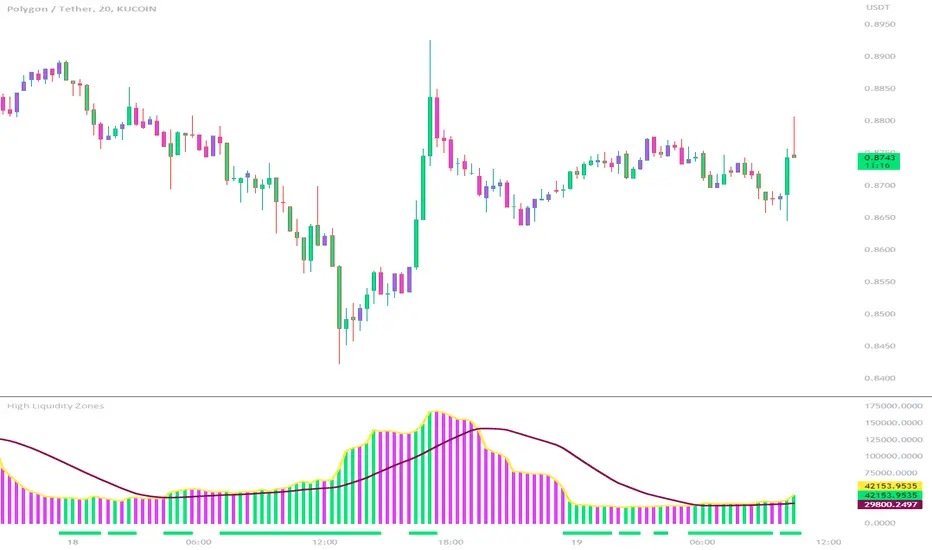
High Liquidity Zones and Threshold VolumeThe High Liquidity Zones indicator is designed to identify areas of significant liquidity in the market. It helps traders recognize regions where trading volume is notably higher, indicating potential areas of increased market activity and interest.
The indicator calculates the average volume over a specified lookback period, which can be customized according to individual preferences. This average volume acts as a reference point to determine the threshold volume level. The threshold percentage input allows users to set the sensitivity of the indicator, defining the minimum volume required for an area to be considered a high liquidity zone.
When the current volume surpasses the threshold volume level, the indicator highlights these areas as high liquidity zones. This visual representation allows traders to quickly identify and focus on periods of heightened trading activity. The high liquidity zones are marked with square shapes below the histogram, providing a clear visual indication on the chart.
The first plot line represents the threshold volume level as a histogram, showing the volume levels in relation to the threshold. This histogram helps traders assess the magnitude of the volume in the identified high liquidity zones.
The second plot line represents the threshold volume's simple moving average (SMA) over the lookback period. The SMA acts as a reference line, smoothing out fluctuations in the threshold volume and providing a more stable measure of high liquidity zones. Traders can use this line to better understand the overall trend and dynamics of liquidity.
The High Liquidity Zones indicator offers flexibility, allowing traders to adapt it to their preferred trading style and timeframe. By adjusting the lookback period and threshold percentage, users can fine-tune the sensitivity of the indicator based on their trading strategies and market conditions.
Furthermore, traders can combine the High Liquidity Zones indicator with other technical analysis tools to confirm trading signals or identify areas of potential support and resistance. It can help them locate price levels where market participants have a substantial presence and where significant buying or selling pressure may occur.
Overall, the High Liquidity Zones indicator is a valuable tool for traders seeking to gain insights into market liquidity dynamics. By highlighting areas of intense trading activity, it assists in making informed trading decisions and identifying opportunities within the market.
Consensio Allocation ToolOriginally created and taught by Taylor Jenks, this indicator provides portfolio allocation suggestions based on the behaviour of price and 3 simple moving averages (4/10/40 by default)
(ie. when short & medium term SMAs are above the long term then allocation is to be 100%).
This percentage allocated to the stock/commodity is to be reduced as it passes below the SMA's, particularly as each moving average crosses.
Consensio is useful for scaling in and out of a position as the portfolio allocation will change according to the momentum of the asset.
The rules below are my own based on understanding of the trading system developed by Jenks and his online content.
This script has the following rules:
if fastAboveSlowMA and not mediumAboveSlowMA
allocation := 30.0
else if longAboveFastMA
allocation := 0.0
else if fastAboveMediumMA and fastAboveSlowMA
allocation := 100.0
else if not fastAboveMediumMA and fastAboveSlowMA
allocation := 80.0
else if not fastAboveMediumMA and not fastAboveSlowMA
allocation := 50.0
else if not mediumAboveSlowMA and fastAboveSlowMA
allocation := 50.0
// Calculate adjusted allocation percentage based on crossing moving averages
allocation := allocation + (priceAboveFastMA ? 10.0 : -10.0)
allocation := allocation + (priceAboveMediumMA ? 10.0 : -10.0)

MultiMovesCombines 3 different moving averages together with the linear regression. The moving averages are the HMA, EMA, and SMA. The script makes use of two different lengths to allow the end user to utilize common crossovers in order to determine entry into a trade. The edge of each "cloud" is where each of the moving averages actually are. The bar color is the average of the shorter length combined moving averages.
-The Hull Moving Average (HMA), developed by Alan Hull, is an extremely fast and smooth moving average. In fact, the HMA almost eliminates lag altogether and manages to improve smoothing at the same time. A longer period HMA may be used to identify trend.
-The exponential moving average (EMA) is a technical chart indicator that tracks the price of an investment (like a stock or commodity) over time. The EMA is a type of weighted moving average (WMA) that gives more weighting or importance to recent price data.
-A simple moving average (SMA) is an arithmetic moving average calculated by adding recent prices and then dividing that figure by the number of time periods in the calculation average.
-The Linear Regression Indicator plots the ending value of a Linear Regression Line for a specified number of bars; showing, statistically, where the price is expected to be. Instead of plotting an average of past price action, it is plotting where a Linear Regression Line would expect the price to be, making the Linear Regression Indicator more responsive than a moving average.
The lighter colors = default 50 MA
The darker colors = default 200 MA

BUY/SELL + ADVANCE DECLINEThis script is a custom trading view indicator that helps to identify potential buy and sell signals based on the RSI (Relative Strength Index) and SMA (Simple Moving Average) indicators. The script also identifies potential reversals using a combination of RSI and price action. It plots buy, sell, and reversal signals on the chart along with an SMA line. Additionally, it provides alerts based on the buy, sell, and reversal conditions.
Changes made to the original script:
Fixed the undeclared identifier 'c' error by calculating the difference between the current closing price and the previous closing price: c = close - close .
Added an "ADD Value Floating Label" to the chart. The label shows the difference between the current and previous closing prices (ADD value) along with a "Bullish" or "Bearish" indicator based on the value of 'c'. The label is positioned at the top right of the visible chart area and remains static.
Here's a summary of the major components of the script:
Input settings: Define the input parameters for RSI and SMA.
Calculation of RSI and SMA: Compute the RSI and SMA values based on the input parameters.
Color definitions: Define colors for different conditions and levels.
Condition definitions: Define various conditions for buy, sell, reversal, and other criteria.
Buy and sell conditions: Determine buy and sell signals based on RSI, SMA, and price action.
Reversal conditions: Identify potential reversals using RSI and price action.
Plot signals: Display buy, sell, and reversal signals on the chart.
Bar colors: Color the bars based on the identified signals.
Plot SMA: Display the SMA line on the chart.
Alert conditions: Set up alerts for buy, sell, and reversal conditions.
ADD Value Floating Label: Add a label to the chart showing the ADD value and a "Bullish" or "Bearish" indicator.

Conceptive Price Moving Average [CSM]The Conceptive Price Moving Average (CPMA) is a technical indicator designed to provide a more accurate moving average of the price by using the average of various price types, such as open, close, high, low, etc. The CPMA can help to smooth out the noise and provide a clearer picture of the overall trend by taking the average of the last 3 candles for each price type and then calculating the average of those averages.
To use the CPMA for generating buy/sell signals, you can look for crossovers of the CPMA and other commonly used moving averages, such as the 9-period EMA, 20-period EMA, 50-period EMA, 100-period EMA, and 200-period EMA, which are also plotted on the chart. When the CPMA crosses above a shorter-term moving average, such as the 9-period EMA or 20-period EMA, it can indicate a potential buy opportunity, while when the CPMA crosses below a shorter-term moving average, it can indicate a potential sell opportunity.
Based on my analysis of BankNifty and Nifty, I have found that the CPMA works best at a length of 21, showing good resistance and support for stocks. Therefore, I recommend using a length of 21 when using the CPMA for generating buy/sell signals.

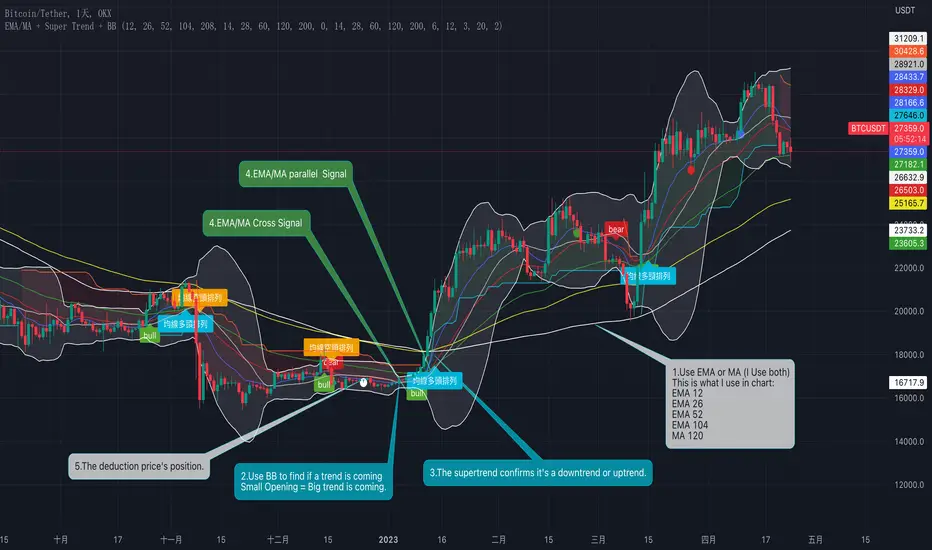
EMA/MA + Super Trend + BBHere is what this indicator does :
1. EMA+SMA moving average system
1. EMA moving average (five in total)
2. SMA moving average (five in total)
3. deduction price
4. EMA/SMA cross prompt: EMA 12//26 cross, or MA14/MA28 cross
5. EMA/SMA parallel prompt: prompt when EMA 12/26/52 is in parallel, or prompt when MA14/MA28/MA 60 is in parallel
Why use EMA 12/26 cross prompt, and MA14/MA28 cross prompt?
Because I backtested BTC based on the winning rate of EMA and MA crossover, its winning rate is higher.
Why use parallel prompt?
Because after the moving averages cross, they will start to be in parallel mode. If you don't see the moving averages be in parallel, it will be a warning sign.
2. Super Trend:
Super Trend is used to assist in judging the current trend.
3. BB Bollinger Bands:
Use the size of the opening to judge whether the major trend is coming.
How to use this indicator? (see chart)
1. Choose EMA or MA, or mix them at the same time
2. Use the Bollinger Bands to find the potential big trend is coming
3. Confirm the trend with Supertrend
4. Use moving averages to confirm crossover and long or short moving average parallel signals
5. The deduction price is used to judge whether the moving average continues to go up or down
Why to do this, why mix them?
1. When the opening of the Bollinger band is very small, it means that the trend is coming
2. Supertrend can help us confirm whether it is an upward or downward trend
3. The crossing and parallel of moving averages can be used as entry trading signals
4. The deduction price is used to judge whether the moving average continues to go up or down
This's why there is a mix of Moving average, Supertrend and BB.
這是這個指標的功能(instructions in Chinese):
一、EMA+SMA 均線系統
1、EMA 均線(共五條)
2、SMA 均線(共五條)
3、抵扣價:可以五條均線的折扣價位置
4、EMA/SMA 交叉提示:EMA 12/EMA 26交叉 或 MA14/MA28 交叉
5、EMA/SMA 排列提示:EMA 12/26/52 呈排列時提示,或 MA14/MA28/MA 60 排列時提示
交叉定義:
二、Super Trend 超級趨勢:
Super Trend 用來輔助判斷當前趨勢。
三、BB 布林帶:
藉由開口大小判斷大趨勢是否即將來臨。
如何使用這個指標?(見圖表說明)
1、選擇EMA或MA均線,或同時混合使用它們
2、用布林帶尋找潛在大趨勢即將來臨
3、用Supertrend 確認趨勢
4、用均線確認交叉與多頭或空頭均線排列訊號
5、抵扣價用來判斷均線是否持續向上或向下
為什麼要這麼做?
1、當布林帶的開口很小時,說明趨勢即將來臨
2、Supertrend 可以幫助我們確認是向上還是向下趨勢
3、均線的交叉與排列可以作為進場交易訊號
4、抵扣價則用來判斷均線是否持續向上或向下
這就是為什麼要混合使用這幾個指標的原因。
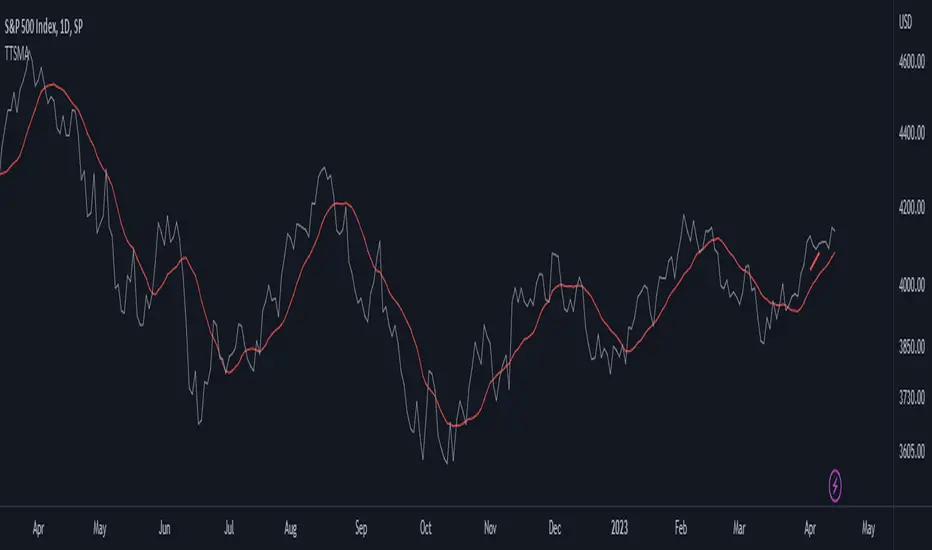
Time-Traveling SMATitle: Time-Traveling SMA - A Unique Technical Indicator for Trend Trading
Introduction:
The Time-Traveling MA (TTSMA) is a playful and inventive technical indicator that combines a simple moving average (SMA) with a forward-shifted line, providing a futuristic perspective on trend direction. By enabling the "Singularity" option, traders can visualize the changing colors of the TTSMA line, representing an upward or downward trend. Although primarily conceptual, the TTSMA can be used as a fun addition to any trading strategy focused on trend-following.
Description:
The TTSMA indicator takes a standard simple moving average (SMA) and shifts it forward in time by a user-defined number of bars. The main idea behind the TTSMA is to provide an estimate of future trend direction, based on current market data. When the "Singularity" option is enabled, the TTSMA line changes color according to the moving average's direction, turning green for upward trends and red for downward trends.
TTSMA-Based Trading Strategy:
A simple trading strategy using the Time-Traveling Moving Average (TTSMA) can be devised as follows:
Define the parameters: Select the preferred length of the SMA (e.g., 14 periods) and the forward shift (e.g., 5 bars). Enable the "Singularity" option for a more visually appealing experience.
Entry Signals:
a. Long Entry: When the TTSMA line turns from red to green, it suggests a potential upward trend. Enter a long position at the close of the signal bar.
b. Short Entry: When the TTSMA line turns from green to red, it indicates a possible downward trend. Enter a short position at the close of the signal bar.
Exit Signals:
a. Long Exit: Close the long position when the TTSMA line turns from green to red.
b. Short Exit: Close the short position when the TTSMA line turns from red to green.
Risk Management: To minimize risk, set a stop-loss at a predefined level below the entry price for long positions and above the entry price for short positions. Adjust the stop-loss to a trailing stop once the trade moves in your favor.
Conclusion:
The Time-Traveling Moving Average (TTSMA) is a playful and experimental indicator that provides a unique approach to trend trading. While not intended for serious trading applications, the TTSMA can be a fun addition to any technical analysis toolbox, offering a creative way to visualize trend direction. Remember to always test any new trading strategy or indicator on a demo account before using it on a live trading account to ensure its effectiveness and suitability to your trading style.
Moving Average Scalper by nnamdertWhat does this Indicator Do?
By request and popular demand, I have created a quick and easy Moving Average Crossover Scalper Indicator. This indicator simply allows the trader to visualize scalping opportunities in an easy way using MA crossovers.
The Indicator also plots multiple higher moving averages via an "optional" table. The table gives a quick glance at the overall trend (based on moving Averages alone).
Users can adjust the initial Moving Average Length and the number of additional Moving Average Lengths to be plotted on the chart.
How do I use it?
As shown below, the cross overs are very easy to see. The Stoploss "should" be set at the most recent swing high or low prior to the MA Cross.
The dotted yellow line must cross above or below the thick mutli-colored line in order to be considered valid.
As seen in the screenshot below, an optional input setting turns ON / OFF additional Moving Average "Lines" and plots them on the chart. In addition, the indicator color fills between the moving averages based on Bullish or Bearish movement. If the lines are in continuity, then the color will be either RED or GREEN depending on the market sentiment (bull or bear).
The total number of Moving Averages listed in the table can be manually adjusted in the settings by the user. The table is small and see-through so it works on mobile devices as well and allows the user to still see the candles easily. Simply double clicking on the table will bring up the settings.
As shown below, the table can be relocated to a position acceptable to the user if it is in the way. This option is available under input settings.
I hope this indicator proves useful for you and your trading style. If you have any suggestions please let me know.
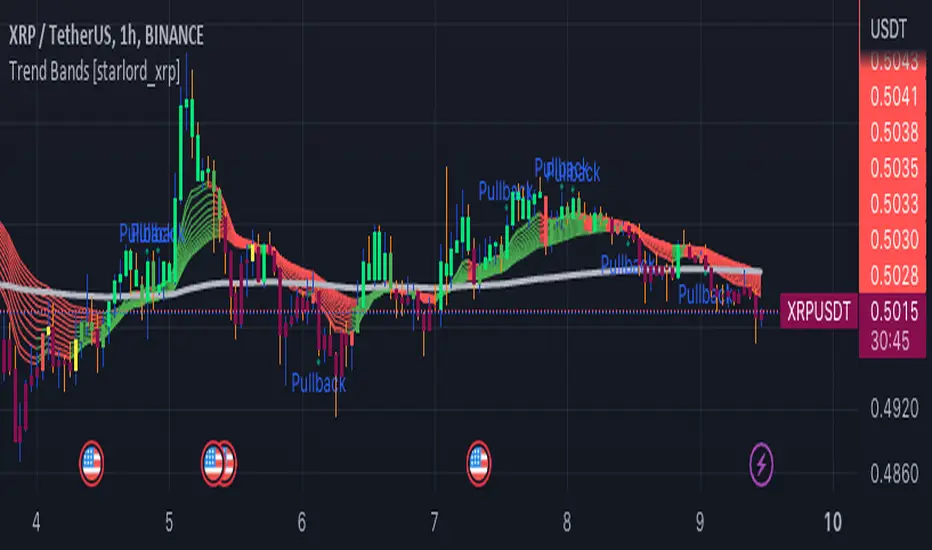
Trend Bands [starlord_xrp]This indicator uses multiple trendlines to determine the overall trend and trend changes. It also highlights areas of potential pullbacks to entry.
Multiple Moving Average ToolkitFeatures Overview:
Multiple Moving Averages: The script allows you to plot up to five different Moving Averages (MAs) on your chart at the same time. You can choose the type of MA (EMA, SMA, HMA, WMA, DEMA, VWMA, VWAP) and the length of each one.
Color Ribbon: You can turn the MAs into a color ribbon by selecting the "Turn into Color Ribbon?" option. This will make the area between the MAs colored and can help you identify trends more easily.
MA Value Table: You can draw a table on your chart that displays the current values of each MA, whether the trend is bullish or bearish along with the length of the MAs. The current ATR value is also shown in the last cell of the table. You can choose the location of the table (Top Left, Top Right, Bottom Left, Bottom Right) and the transparency of the background color.
Crosses: The script can detect when two MAs cross over each other (1st MA crosses 5th MA and vice versa), indicating a potential trend reversal. It will plot crosses on the chart at the point of the crossover and give an alert if the "Bullish Cross Detected" or "Bearish Cross Detected" condition is met.
How to use:
Once the script is added to your chart, you can customize the settings to fit your preferences. You can choose the type and length of each MA, whether to turn them into a color ribbon, whether to plot crosses, and whether to draw the MA Value Table.
The MA Value Table can be moved to a different location on the chart by selecting the "Location of Table" option and choosing Top Left, Top Right, Bottom Left, or Bottom Right.
Watch for MA crossovers and alerts to identify potential trend reversals. The script can help you identify bullish and bearish trends by color-coding the area between the MAs and displaying the current values of each MA in the table.
Breakdown of the script:
User Inputs
The first section of the script defines several user inputs that allows you to customize the indicator. These include options for turning the MAs into a color ribbon, plotting crosses when there is a bullish or bearish cross of the MAs, drawing a table of the MA values, and setting the transparency of the ribbon. You can also select the location of the MA value table and customize the settings for each individual MA.
Moving Average Calculation
The script defines a function called "getMA" that calculates the moving average for a given type and length. The function uses a switch statement to determine which type of moving average to use, such as an exponential moving average (EMA), simple moving average (SMA), Hull moving average (HMA), weighted moving average (WMA), double exponential moving average (DEMA), volume-weighted moving average (VWMA), or volume-weighted average price (VWAP).
The script then calls this function to calculate the values of up to five different MAs, depending on the user input. The ATR (average true range) is also calculated using the TA library.
Color Filter and Cross Detection
The script sets a color filter based on the relationship between the MAs. If the shorter-term MAs are above the longer-term MAs, the filter is set to green to indicate a bullish trend, and if the shorter-term MAs are below the longer-term MAs, the filter is set to red to indicate a bearish trend. You can adjust the transparency of the ribbon to make it more or less visible.
The script also detects when there is a bullish or bearish cross of the MAs and can generate alerts to notify you.
MA Plotting
The script plots up to five MAs on the chart, depending on the user input. The MAs are plotted as lines with different colors and thicknesses, and you can choose to turn them into a color ribbon if desired.
Cross Plotting
The script plots crosses on the chart when there is a bullish or bearish cross of the MAs. The crosses are plotted as X shapes at the location of the cross and are color-coded to indicate the direction of the cross.
MA Value Table
Finally, the script draws a table of the MA values on the chart, displaying the values of each MA as well as the current trend and the ATR. You can customize the location of the table, and the table is colored to match the color filter of the MAs.
Feel free to message me or comment on the post with any questions or issues!
Much more to come!
Thanks for reading, enjoy!

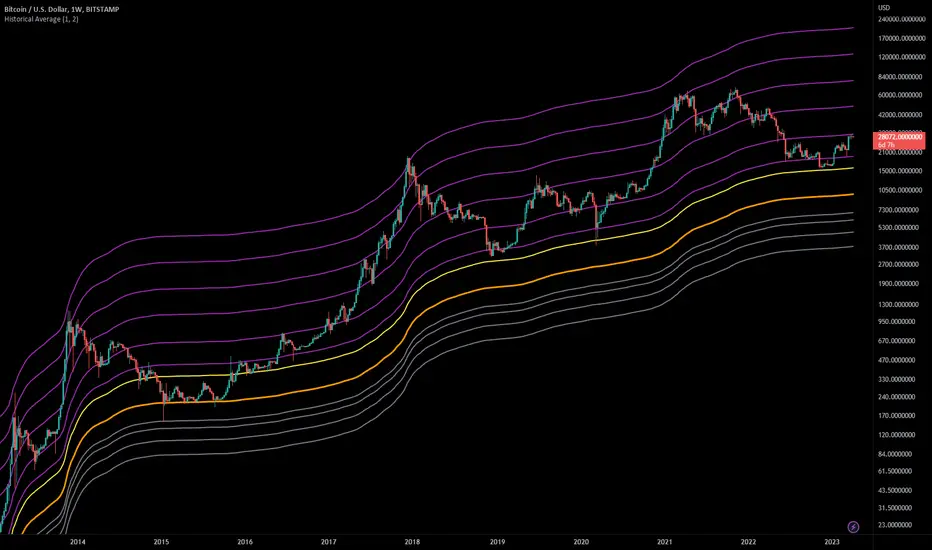
Historical AverageThis indicator calculates the sum of all past candles for each new candle.
For the second candle of the chart, the indicator shows the average of the first two candles. For the 10th candle, it's the average of the last ten candles.
Simple Moving Averages (SMAa) calculate the average of a specific timeframe (e.g. SMA200 for the last 200 candles). The historical moving average is an SMA 2 at the second candle, an SMA3 for the third candle, an SMA10 for the tenth, an SMA200 for the 200th candle etc.
Settings:
You can set the multiplier to move the Historical Moving Average along the price axis.
You can show two Historical Moving Averages with different multipliers.
You can add fibonacci multipliers to the Historical Moving Average.
This indicator works best on charts with a lot of historical data.
Recommended charts:
INDEX:BTCUSD
BLX
But you can use it e.g. on DJI or any other chart as well.
Colorful Moving Averageswhat is Colorful Moving Averages?
This indicator allows you to use your favorite moving averages in their advanced form.
what it does?
It gives you easy access to the following information with a single indicator: the direction and momentum of the price,
rate of change of momentum (acceleration),
time-dependent change in momentum,
and all the other information a moving average provides.
it paints the selected moving average type according to the momentum it has, and also shows the momentum and acceleration values in a table. colors are interpreted as follows: the color of the moving average is red, the momentum is negative; A green color means the momentum is positive, and a yellow color means the momentum is 0. As the momentum changes, the moving average takes on different shades of these 3 colors. how it actually works can be easily understood at a glance.
"Δ" sign indicates momentum compressed between 100 and -100.
"Γ" sign indicates the momentum of the momentum, that is the acceleration. its values are compressed between 100 and -100.
how it does it?
it uses this formulas:
how to use it?
First, select the moving average type you want to use. then set the length and source. Now, with a single indicator, you can observe both the distance of the price from the mean, its instantaneous momentum relative to the last candle by looking at the symbol "Δ", the current change of momentum by looking at the symbol "Γ", and the time-dependent change in its momentum by looking at the colors. you can also see the maximum and minimum points where the momentum is equal to 0.

Moving Average Lab - by InFinitoThe Moving Average Lab allows to create any possible combination of up to 3 given MAs. It is meant to help you find the perfect MA that fits your style, strategy and market type.
This script allows to average, weight, double and triple multiple types and lengths of Moving Averages
Currently supported MA types are:
SMA
EMA
VWMA
WMA
SMMA (RMA)
HMA
LSMA
DEMA
TEMA
Features:
- Double or Triple any type of Moving Average using the same logic used for calculating DEMAs and TEMAs:
In the following example you can see a normal, double and triple 200 VWMA
- Average 2 or 3 different types and lengths of Moving Average:
In the example you can see the average between a Double LSMA and a SMA
- Weight each MA manually:
The example shows the average of an HMA and a VWMA with the HMA having a weight of 2 and the VWMA having a weight of 1
- Average up to 3 personalized MAs:
The example shows the average of an EMA + a Double WMA + a Triple SMA with a 3:2:1 weighting
- Average different Moving Averages with different length each:
The example shows the average of an 800 SMA + a 400 VWMA + a 200 EMA

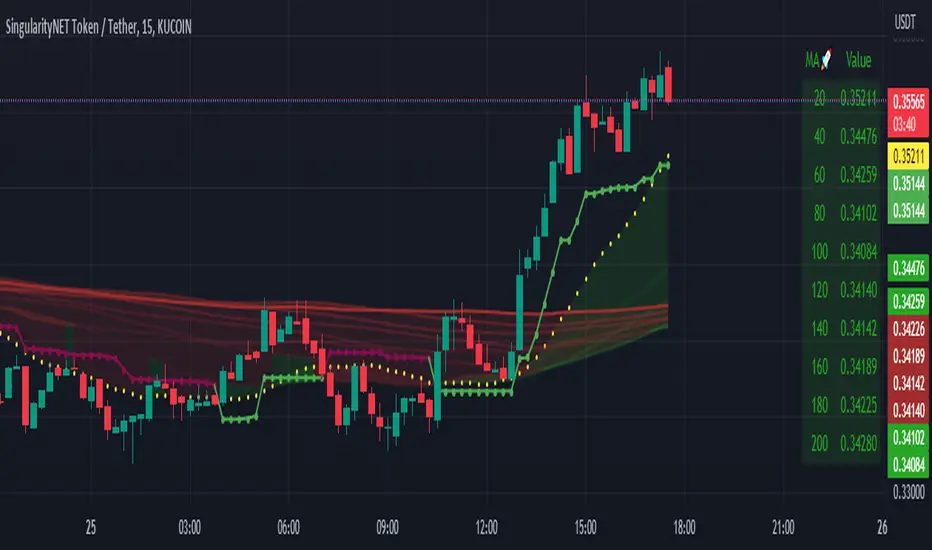
Rainbow Moving AverageA Rainbow Moving Average script. There are many like it, but this one is mine. It is designed to be easy to read without too much noise in the number of lines and shading, with the moving average to be some of the commonly used ones. Using commonly referenced moving average values help us to understand "the crowd" and what moving average or trend lines they might be looking at. The default values are derived from hourly charts, but work well on any time frame.
The moving average function is simple to change so you can use it for any moving average type that you like, including volume-weighted.
Inspired by my daughter's love of rainbows, she has approved the colors.

Centred Moving AverageBased around the Centered Moving Average as published by Vailant-Hero this script is revised and improved to aid with execution time & server load. For full description follow the link as above, as Valiant-Hero explains the idea perfectly well.
While the original script worked fine for small values of length, once length was extended significantly or chart timeframe set to short values then the script is prone to exceeding computation requirements. The original script was attempting to delete and re-draw (length x 3) lines on the chart for each tick. In addition to server load, once length is greater than 167 (500/3) then the first drawn lines start disappearing, so the predicted values no longer appear connected to the offset averages calculated from the candle data. A further error resulted with larger values of "length" and future data selected, in that the script would try and move lines more than 500 bars into the future.
Improvements and major code changes
All values for the predicted moving average lines are calculated from a single run through of the data, rather than having to loop back through the data "length" times (and then through it again "length" times if you selected double moving average). Each loop also inefficiently calculated the sum of "length" values by recalling each one individually.
Number of lines are thus reduced so that we're never attempting to plot more than "max_lines_count" onto the chart. User is able to select the granularity of the lines - more sections will mean a smoother line but at the expense of processing speed.
No matter the combination of "length" and the selected granularity of the lines, no line will be drawn if its endpoint would be more than 500 bars in the future.
Code for "Double SMA" only affected the predicted data values, rather than affecting the historic calculations (and standard deviation calcs) as well as the predictions. This has been included and results in much smoother lines when "Double Moving Average" is selected.
Striped lines for the predicted values - firstly to make it obvious where the "predictions" begin, and also because they look funky.
Rekt Edge Reversion BandRekt Edge Reversion band is a technical indicator that utilizes a combination of moving averages and standard deviations to determine optimal entry and exit points in the market. By comparing the current price to its moving average, the indicator identifies potential trends and determines how you can position around them by plotting buy/sell signals and two channels based on user input parameters. The user can choose between Simple Moving Average ( SMA ) or Exponential Moving Average ( EMA ) and select the moving average period, the unit of separation, the multiples of the unit, and other important parameters. The indicator's inputs can be adjusted to suit different trading styles, and it can be used on any time frame. The indicator can be used to identify potential trend reversals or breakouts (or breakdowns) when the price moves outside of the channels. The indicators potential use cases include identifying overbought or oversold conditions. With its ability to provide a clear signal on when to enter and exit a trade, this indicator is a popular tool among traders looking to make more informed and profitable trading decisions. This indicator can also be used in conjunction with other technical analysis tools to confirm or invalidate trading signals.
