بحث
المنتجات
التواصل الاجتماعي
الأسواق
الوسطاء
المزيد
AR
ابدأ الآن
المؤشرات والاستراتيجيات
/
Spread
Spread
جميع الأنواع
جميع الأنواع
المصدر المفتوح فقط
المصدر المفتوح فقط
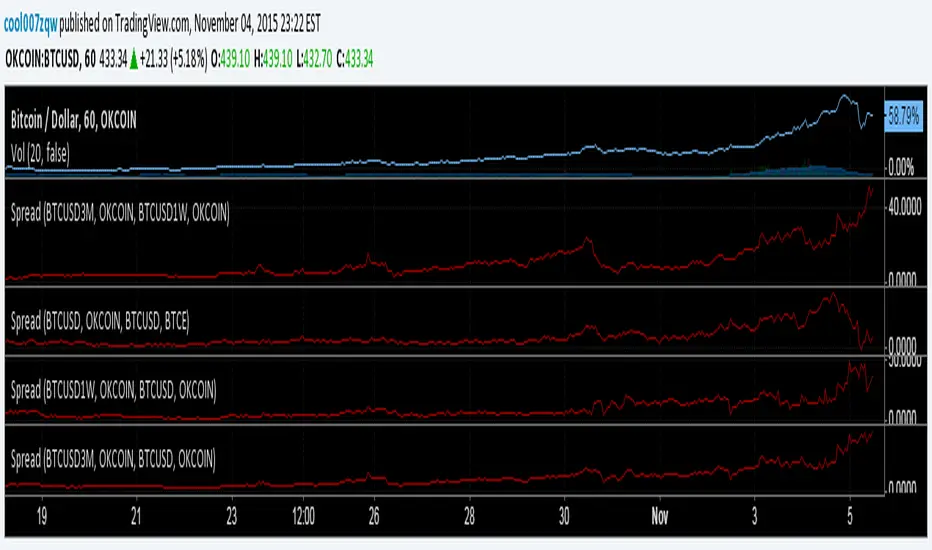
Spread
ZENO
مؤشر Pine Script®
من cool007zqw
3
3
1
5
7
1
1
2
2
3
3
4
4
…
999
999