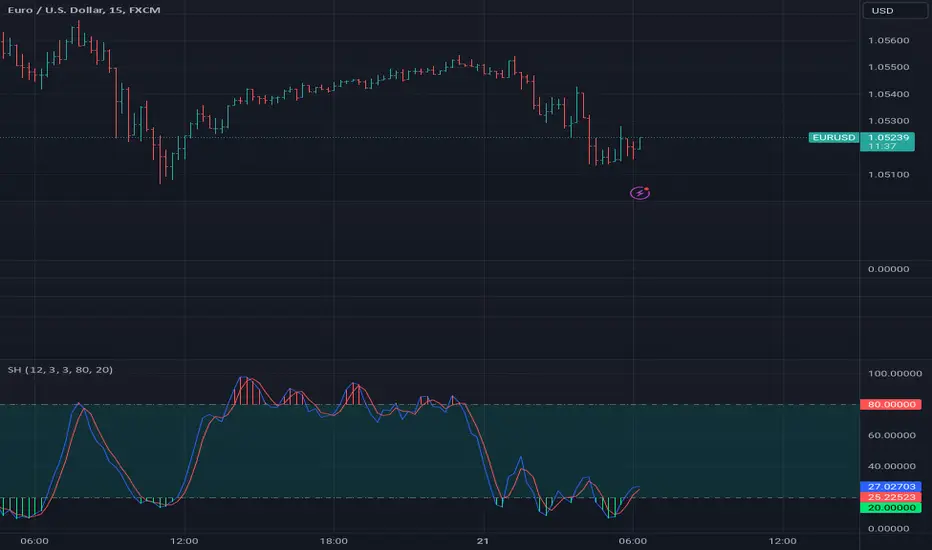
Stoch_VX3Stoch_VX3
Upgrade from Stoch_VX2
*Cross over markers
*Directional bgcolor indication
To run in line with the VX family / or stand alone :-
Baseline_VX1
MACD_VX1
Stoch_VX3 (this one)
/Strategy, line up all three, place your bets - Black or Green :)
مؤشر الاستوكاستك

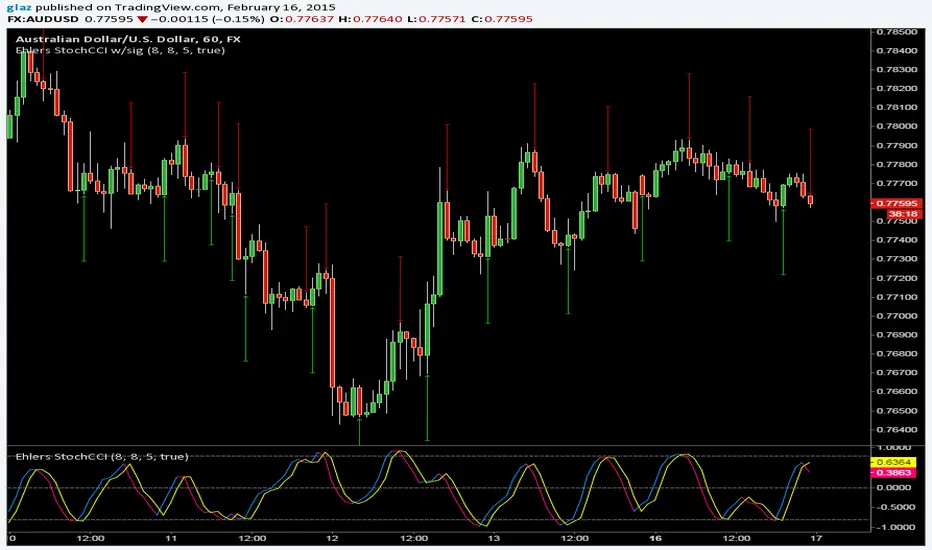
DiNapoli MACD & Stoch [LazyBear] --- Updated: May 19 2015 ----
Applicable only If you are setting up alerts:
I noticed I have switched the plot names. Histo shd be the MACD and DMACD shd be the Signal.
Replace lines 16 & 17 with these to get the correct names. NOTE that no functionality is affected, just the names.
plot(r, style=columns, color=r>0?green:red, transp=80, title="Dinapoli MACD")
plot(s, color=teal, linewidth=2, title="Trigger")
--- Original Description ---
These two indicators are from one of my favorite books - DiNapoli's Levels. These are custom MACD and Stoch used by him. There are more indicators - Detrended Osc, DisplacedMA - that he uses, will publish them all later.
The settings of normal MACD/Stoch can be tuned to obtain these DiNapoli indicators, or if you are lazy (like me!) just use these :)
DiNapoli Preferred Stoch source: pastebin.com
More info:
www.amazon.com
List of my public indicators: bit.ly
List of my app-store indicators: blog.tradingview.com

Stoch_VX2Nothing New about a Stochastic but maybe in how you use them ( Other than Over bought / Sold cross over & divergence signals )
Running 3 bands
Standard stoch & tops & bottoms swing band
Optimised variables 12, 5 , 3 or fib 13, 5, 3 / - 12 / 3 / 3 a little bit tighter to combine both smoothness & accuracy. These are my own personal setting inc. Strategy.

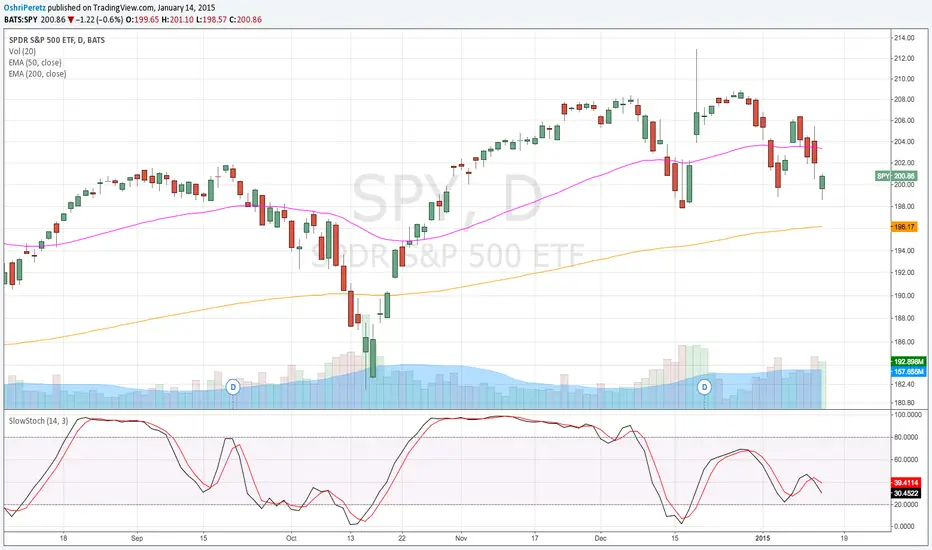
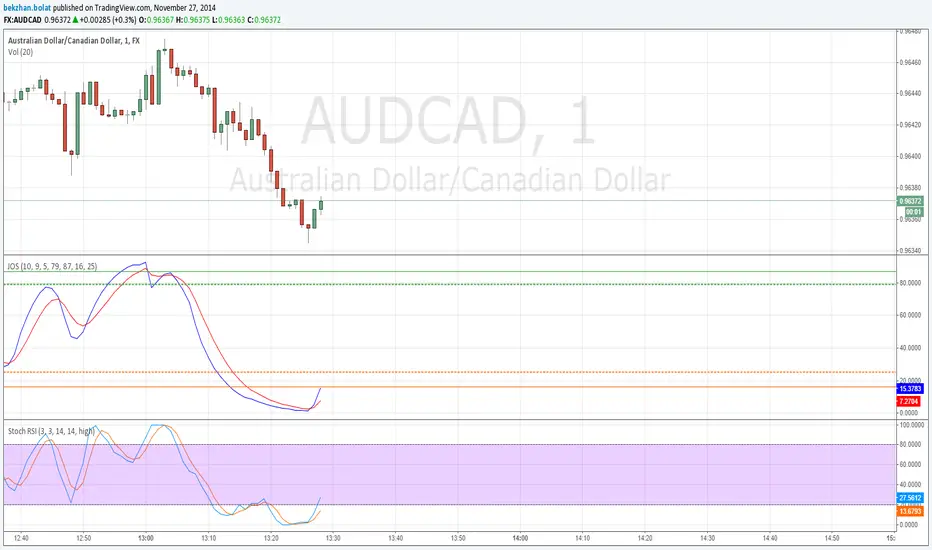
Trend, Stoch, Price Action or in short: TSPCombining the three most important factors that a trader usually needs in a single indicator.
Red = Trend
Blue = Stoch
Orange = Price Action

CM Stochastic POP Method 2-Jake Bernstein_V1Yesterday Jake Bernstein authorized me to post his updated results with the Stochastic Pop Trading System he developed many years ago.
You can take a look at the Original System with Updated Settings at
This indicator is a different set of rules Jake mentioned in the PDF he allowed me to post.
To view the PDF use this link:
dl.dropboxusercontent.com
Today we’re releasing the version described in the PDF that uses the StochK values of 55, 50, and 45. The rules are discussed in the PDF but here is a simple breakdown:
Enter Long when StochK is below 50 and Crosses Above 55
Exit Long on Cross Below 55
Enter Short when StochK is Above 50 and crosses Below 45
Exit Short on Cross Above 45
Two Important Items to understand about this method:
To code the rules Precisely we need a function that will be available when Strategy Capabilities are released on TradingView.
There is one of Jakes Profit Maximizing Strategies that needs to be integrated with this code…which again we need the Strategy based Function that will be coming soon.
To Compare this system to the Stochastic Pop Method 1 System shown yesterday at I used the same Symbol and dates for you to compare…but remember to give this Method 2 System a Fair Look/Evaluation…we need the Soon To Be Released…TradingView Strategy Capabilities.
BackTesting Results Example: EUR-USD Daily Chart Since 01/01/2005
Strategy 1 – Stochastic Pop Method 2 System:
Go Long When Stochasticis below 50 and Crosses Above 55. Go Short When Stochastic is above 50 and Crosses Below 45. Exit Long/Short When Stochastic has a Reverse Cross of Entry Value.
Results:
Total Trades = 151
Profit = 40,758 Pips
Win% = 37.1%
Profit Factor = 1.26
Avg Trade = 270 Pips Profit
***Most Consecutive Wins = 4 ... Most Consecutive Losses = 7
Strategy 2:
Rules - Proprietary Optimization Jake Will Teach. Only Added 1 Additional Exit Rule.
Results:
Total Trades = 151
Profit = 60.305 Pips
Win% = 37.1%
Profit Factor = 1.38
Avg Trade = 399 Pips Profit
***Most Consecutive Wins = 4 ... Most Consecutive Losses = 7
Indicator Includes:
-Ability to Color Candles (CheckBox In Inputs Tab)
Green = Long Trade
Blue = No Trade
Red = Short Trade
Jake Bernstein will be a contributor on TradingView when Backtesting/Strategies are released. Jake is one of the Top Trading System Developers in the world with 45+ years experience and he is going to teach TradingView.com’s community how to create Trading Systems and how to Optimize the correct way.
Link To PDF:
dl.dropboxusercontent.com
Link to Original Version of Indicator with Updated Settings.

CM Stochastic POP Method 1 - Jake Bernstein_V1A good friend ucsgears recently published a Stochastic Pop Indicator designed by Jake Bernstein with a modified version he found.
I spoke to Jake this morning and asked if he had any updates to his Stochastic POP Trading Method. Attached is a PDF Jake published a while back (Please read for basic rules, which also Includes a New Method). I will release the Additional Method Tomorrow.
Jake asked me to share that he has Updated this Method Recently. Now across all symbols he has found the Stochastic Values of 60 and 30 to be the most profitable. NOTE - This can be Significantly Optimized for certain Symbols/Markets.
Jake Bernstein will be a contributor on TradingView when Backtesting/Strategies are released. Jake is one of the Top Trading System Developers in the world with 45+ years experience and he is going to teach how to create Trading Systems and how to Optimize the correct way.
Below are a few Strategy Results....Soon You Will Be Able To Find Results Like This Yourself on TradingView.com
BackTesting Results Example: EUR-USD Daily Chart Since 01/01/2005
Strategy 1:
Go Long When Stochastic Crosses Above 60. Go Short When Stochastic Crosses Below 30. Exit Long/Short When Stochastic has a Reverse Cross of Entry Value.
Results:
Total Trades = 164
Profit = 50, 126 Pips
Win% = 38.4%
Profit Factor = 1.35
Avg Trade = 306 Pips Profit
***Most Consecutive Wins = 3 ... Most Consecutive Losses = 6
Strategy 2:
Rules - Proprietary Optimization Jake Will Teach. Only Added 1 Additional Exit Rule.
Results:
Total Trades = 164
Profit = 62, 876 Pips!!!
Win% = 38.4%
Profit Factor = 1.44
Avg Trade = 383 Pips Profit
***Most Consecutive Wins = 3 ... Most Consecutive Losses = 6
Strategy 3:
Rules - Proprietary Optimization Jake Will Teach. Only added 1 Additional Exit Rule.
Results:
Winning Percent Increases to 72.6%!!! , Same Amount of Trades.
***Most Consecutive Wins = 21 ...Most Consecutive Losses = 4
Indicator Includes:
-Ability to Color Candles (CheckBox In Inputs Tab)
Green = Long Trade
Blue = No Trade
Red = Short Trade
-Color Coded Stochastic Line based on being Above/Below or In Between Entry Lines.
Link To Jakes PDF with Rules
dl.dropboxusercontent.com

UCS_S_Stochastic Pop and Drop StrategyMy Contribution to Jake Bernstein Educational Series, Initiated by Chris Moody.
The Stochastic Pop was developed by Jake Bernstein and modified by David Steckler. Bernstein's original Stochastic Pop is a trading strategy that identifies price pops when the Stochastic Oscillator surges above 80. Steckler modified this strategy by adding conditional filters using the Average Directional Index (ADX) and the weekly Stochastic Oscillator.
Modifications
1. Weekly Stochastic Oscillator for Trading Bias = 5* Daily Stochastic
2. Optional Volume Confirmation, Custom Average Volume Length
Future Plans
1. Adding Triggers for Entry, Stops and Target. - This will be release when we have ability to code the complete Strategy. Although it can be done with the current pinescript options, it would be far more easier if we have strategy ability.
Link for Educational Purpose
stockcharts.com
-
Good Luck Trading
UCSgears

Insync Index [LazyBear]BB Support + Histo mode
-------------------------------
Code: pastebin.com
Show enclosing BB
Show Insync as Histo:
v02 - Configurable levels
---------------------------------
Small update to allow configuring the 95/75/25/5 levels.
Latest source code: pastebin.com
v01 - orginal description
---------------------------------
Insync Index, by Norm North, is a consensus indicator. It uses RSI, MACD, MFI, DPO, ROC, Stoch, CCI and %B to calculate a composite signal. Basically, this index shows that when a majority of underlying indicators is in sync, a turning point is near.
There are couple of ways to use this indicator.
- Buy when crossing up 5, sell when crossing down 95.
- Market is typically bullish when index is above 50, bearish when below 50. This can be a great confirmation signal for price action + trend lines.
Also, since this is typical oscillator, look for divergences between price and index.
Levels 75/25 are early warning levels. Note that, index > 75 (and less than 95) should be considered very bullish and index below 25 (but above 5) as very bearish. Levels 95/5 are equivalent to traditional OB/OS levels.
The various values of the underlying components can be tuned via options page. I have also provided an option to color bars based on the index value.
More info: The Insync Index by Norm North, TASC Jan 1995
drive.google.com
List of my free indicators: bit.ly
List of my app-store indicators: blog.tradingview.com
(Support doc: bit.ly)


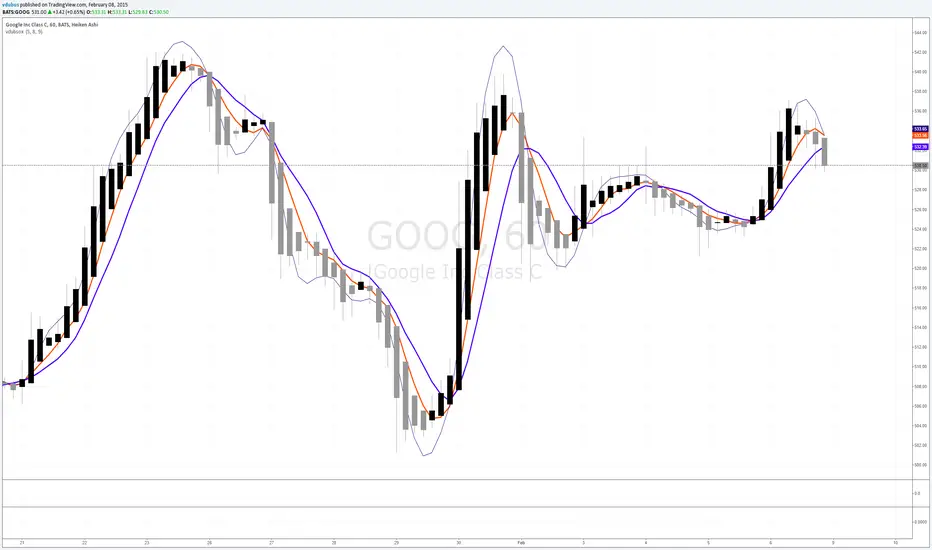
vdubsoxI've been asking for this concept for a while, a simple MA that rides the top side of the trend instead of the bottom, and by accident came across the 'Hull ma' on a TV blog post. I've added another two simple Moving averages to act as strength indicator with close proximity to the price.
The strategy is simple MA cross over but with the early indication using Hull ma gives you a heads up on trend / price reversal.
I'm using this in conjunction with BB set at 34. on a 1/3/5 min charts & Heiken Ashi to smooth out the noise with awesome success trading Binary options.
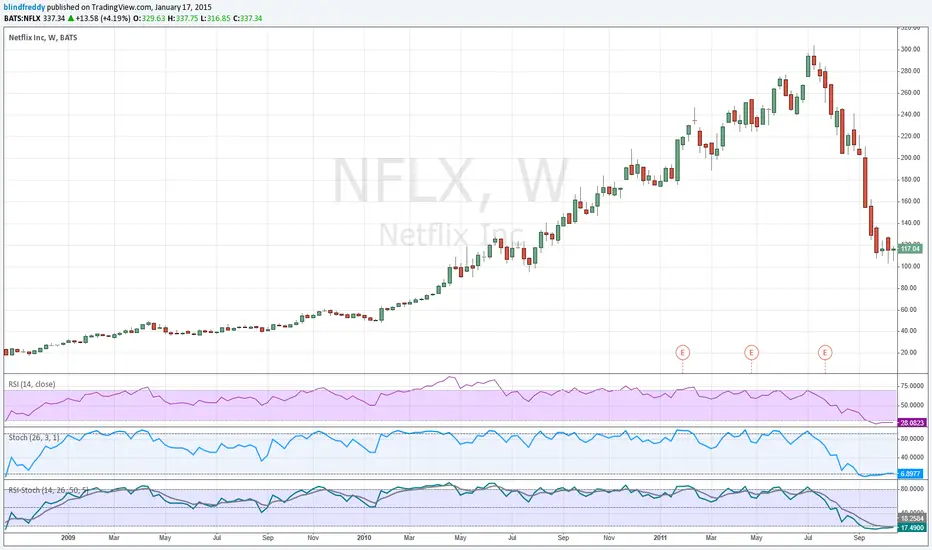
RSI-Stochastic Hybrid v2**For those who like a smooth ride...v2 of this script is now updated with optional exponential averaging of the stochastic and RSI. So for instance a value of 3 for smoothing of the stochastic is like using %D instead of %K. **
This is a very simple idea - an average of RSI and the Stochastic Oscillator. However it offers plenty of flexibility for tuning to your requirements. You can change the lengths of either indicator and the weighting of each. By default it's set to 50/50 (just change the percent RSI to adjust). There is also an optional EMA which can be used as a signal line.
This idea comes from Greg Morris who likes to use it for trend following. I would buy when the indicator hits the overbought line and sell when it goes below 50.

RSI-Stochastic HybridThis is a very simple idea - an average of RSI and the Stochastic Oscillator. However it offers plenty of flexibility for tuning to your requirements. You can change the lengths of either indicator and the weighting of each. By default it's set to 50/50 (just change the percent RSI to adjust). There is also an optional EMA which can be used as a signal line.
This idea comes from Greg Morris who likes to use it for trend following. I would buy when the indicator hits the overbought line and sell when it goes below 50.
Slow StochasticThe slow stochastic indicator is a price oscillator that compares a security’s closing price over “n” range. The most commonly used range for the slow stochastic indicator is 14.
Defaults K=14, D=3
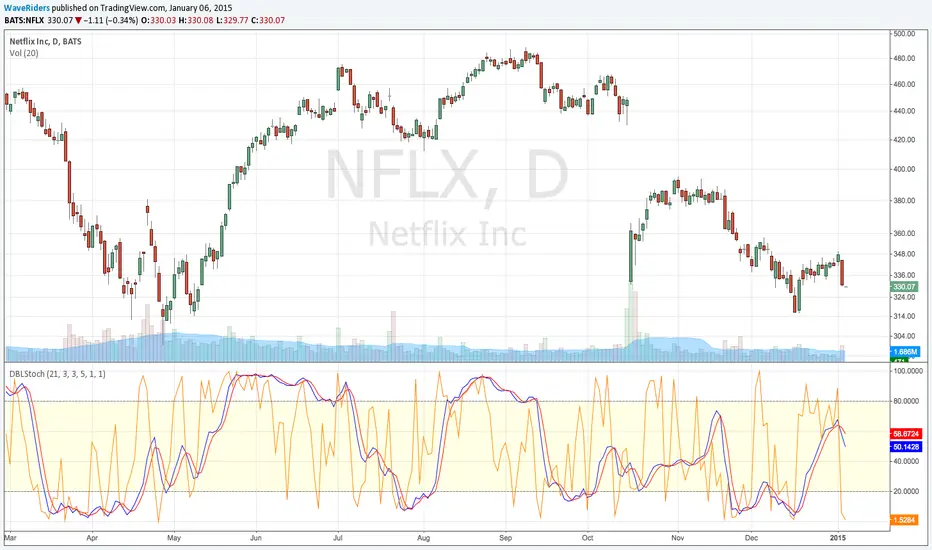
Double StochasticDouble Stochastic is use 2 Stochastic for monitoring price swing.
Slow Stochastic (21,3,3) for monitoring the swing of price cycle.
Fast Stochastic (5,1,1) for monitoring the swing in price ripple.
When 2 Stochastic run way from each other, separately , mean Price will move only retrace or rebound in ripple movement.
When 2 Stochastic Flip and Run break thru from overbought or oversold zone , mean Price will move to change in major direction
Useful for decision to hold position or take action
Such as Price move up and start decline, Slow Stochastic run above 80 and only Fast Stochastic swing down, mean Price just move retrace down. Price still has chance to flip and move up again. This will help we hold the Long Position or know where to open more Long position on price dip.
Or Price break down to support line and start rebound , Slow Stochastic run below 20 and only Fast Stochastic Swing Up , mean Price just move rebound to go down again. This will help we can hold Short Position or know where to open more Short position.
Wave Riders ...
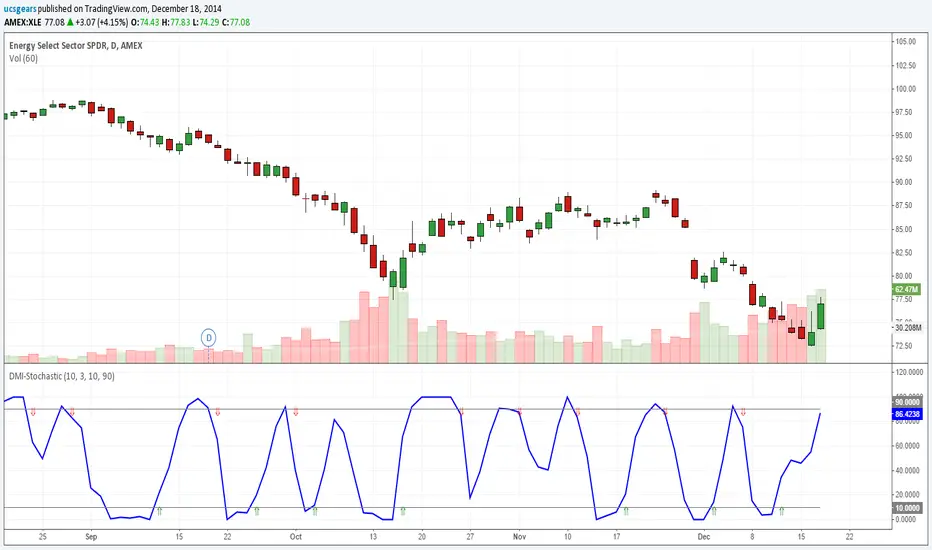
DMI Stochastic Extereme - Version 2Version 2 Includes
Custom setting for the Oversold and Overbought Levels
Replaced B and S with arrows
Cleaned up the code and finalized the indicator.
*Unless there is a real need, this indicator will not be revised further.
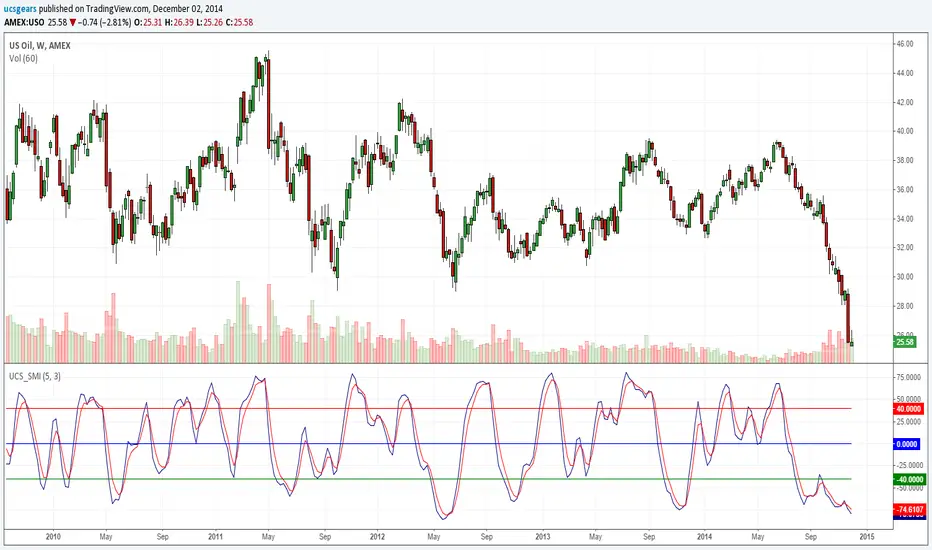
Stochastic Momentum Index _ UCSgearsThe Stochastic Momentum Index (SMI) was introduced by William Blau in 1993 as a way to clarify the traditional stochastic oscillator. SMI helps you see where the current close has taken place relative to the midpoint of the recent high to low range is based on price change in relation to the range of the price. This is a range based indicator, when used right. It can help momentum changes.
For those looking for help understanding this -
wiki.timetotrade.eu
www.tradingstrategyideas.com
tlc.thinkorswim.com
www.sierrachart.com
CM Stochastic Multi-TimeFrameMulti TimeFrame Stochastic Loaded With Features.
Basics:
Ability to turn On/Off Crosses Only Above or Below High/Low Lines.
User sets Values Of High/Low lines.
Ability to turn On/Off All Crosses, Both BackGround Highlights and “B”, “S” Letters.
Ability to turn On/Off BackGround Highlights if Stoch is Above Or Below High/Low Lines.
Ability to All or Any Combination of these Features.
Multi Timeframe Capabilities:
Stoch defaults to current timeframe. You can change to many other timeframes.
Ability to turn On/Off Plotting 2nd Stoch on same TimeFrame with different settings
Ability to turn On/Off Plotting 2nd Stoch on Different TimeFrame
Much More…All Inputs and Options are Adjustable in Inputs Tab.

UCS_Momentum Oscillator - Version 2This is Version - 2 of the Momentum Oscillator, Like i said on the prior version, This version has an Indicator for Trends.
Marks only Overbought and Oversold Based on the TREND.
The Trend dots are calculated exactly like the Slingshot system trend.

DMI Stochastic Extreme - DMI Stochastic Extreme - Version 2
- Replaced B with , Replaced S with
- Ability to change Overbought and Oversold Levels
- Clean PineScript
List of All my Indicators - www.tradingview.com
