Fibo Normalized RSI & RSI RibbonPlots both standard and Z-score normalized RSI ribbons using Fibonacci-based periods. Supports adjustable normalization, optional 0–100 scaling, and multi-line visualizations for momentum and deviation analysis.
This tool is designed for traders who want to go beyond standard RSI by adding:
Statistical normalization (Z-score)
Multi-period analysis (Fibonacci structure)
Advanced divergence and exhaustion detection
It gives you both classical momentum context and mathematically rigorous deviation insight, making it ideal for:
Swing traders
Quant-inclined discretionary traders
Multi-timeframe analysts
Trend Confirmation
When both RSI and normalized RSI across short and long periods are stacked in the same direction (e.g., above 50 or with high Z-scores), the trend is likely strong.
Disagreement between the two ribbons (e.g., RSI high but normalized RSI flat) may indicate late-stage trend or false strength.
Mean Reversion Trades
Look for normalized RSI values > +2 or < -2 (i.e., ~2 standard deviations).
Cross-check with standard RSI to see if the move aligns with a traditional overbought/oversold level.
Great for fade/reversal setups when Z-score RSI is extreme but classic RSI is just beginning to turn.
Divergence Detection
Compare the slope of RSI vs. normalized RSI over same period:
If RSI is rising but normalized RSI is falling → momentum is fading despite apparent strength.
Excellent for early warnings before reversals.
Multi-Timeframe Confluence
Use short-period ribbons (e.g., 3–13) for tactical entries/exits.
Use long-period ribbons (e.g., 55–233) for macro trend bias.
Alignment across both = high-confidence zone.
Stretch

PumpC Opening Range Breakout (ORB) Stretch RangePumpC ORB Stretch
The PumpC ORB Stretch is a volatility-based indicator that helps traders identify potential breakout zones by analyzing how price typically behaves around the open. This tool is inspired by concepts introduced by Toby Crabel in his well-known book “Day Trading with Short-Term Price Patterns and Opening Range Breakout.”
Rather than predicting market direction, this indicator highlights areas where price is likely to expand based on recent volatility. It is designed for traders who prefer dynamic, data-driven breakout levels over static support and resistance zones.
What Is the "Stretch"?
In Toby Crabel’s framework, the Stretch is the average of the smaller of two price moves:
The distance from the open to the high of the bar
The distance from the open to the low of the bar
This smaller value captures the “quiet side” of the candle and reflects recent price compression. Averaged over multiple periods (commonly 10 daily bars), it creates a baseline to assess how far price may move away from the open under typical market conditions.
How the Indicator Works
The PumpC ORB Stretch follows this process:
Uses a higher timeframe (such as daily) to calculate the open, high, and low.
For each bar, measures the smaller of the two distances: open to high or open to low.
Applies a moving average to the result over a user-defined number of bars (default is 10).
Multiplies the average stretch by customizable levels (e.g., 0.382, 1.0, 2.0).
Plots breakout levels above and below the open of the selected timeframe.
The result is a set of adaptive levels that expand or contract with market volatility.
Customization Options
Stretch Timeframe: Choose the timeframe used for stretch calculation (default: Daily).
Stretch Length: Set the number of bars to include in the moving average.
Breakout Levels: Enable or disable individual levels and define multipliers.
Color Settings: Customize colors for each range level for easy visual distinction.
Plot Style: Circular markers are used to reduce chart clutter and improve readability.
How to Use It
Use plotted levels to anticipate possible breakouts from the open.
Adjust stretch length to reflect short-term or longer-term volatility trends.
Combine this tool with momentum indicators, volume, or price action for confirmation.
Use levels to help guide stop placement or profit targets in breakout strategies.
Important Notes
This script is based on an interpretation of Crabel’s concepts and is not affiliated with Crabel Capital or the original author.
The indicator does not predict direction; it is a tool for context and structure.
It is recommended that users test and validate this tool in a simulated environment before applying it to live trading.
This indicator is intended for educational purposes only.
Licensing and Attribution
This script is built entirely in Pine Script v5 and follows TradingView’s open-source standards. It does not include any third-party or proprietary code. If you modify or share it, please credit the original idea and follow all TradingView script publishing rules.

David Varadi Intermediate OscillatorThe David Varadi Intermediate Oscillator (DVI) is a composite momentum oscillator designed to generate trading signals based on two key factors: the magnitude of returns over different time windows and the stretch, which measures the relative number of up versus down days. By combining these factors, the DVI aims to provide a reliable and objective assessment of market trends and momentum.
Methodology:
To calculate the DVI, a specific formula is applied. The magnitude component involves averaging smoothed returns over various lengths, weighted according to user-defined parameters. This calculation helps determine the magnitude of price changes. The stretch component follows a similar process, averaging smoothed returns over different lengths to gauge market momentum. Users have the flexibility to adjust the weights and lengths to suit their trading preferences and styles.
Utility:
The DVI offers versatility in its applications. It can be used for both momentum trading and trend analysis due to its smooth and consistent signals. Unlike some other oscillators, the DVI provides longer and uncorrelated signals, allowing traders to effectively combine trend-following and mean-reversion strategies. For example, the DVI is adept at identifying overbought levels above the 200-day moving average, serving as a useful tool for determining exit points during price strength and even potential shorting opportunities. Traders can develop simple trading systems based on the DVI, buying above the 200-day moving average and selling when the DVI exceeds a specified threshold. Conversely, they can consider short positions below the 200-day moving average and cover when the DVI falls below a specific threshold. The DVI's objective approach to analyzing market momentum makes it a valuable resource for traders seeking to identify trading opportunities.
Key Features:
Bar coloring: based on Trend, Extremeties or Reversions
Reversions: Potential reversal points marked with triangles above\below oscillator
Extremity Hues: Highlighting oxcillator reaching traditional OB\OS levels
Example Charts:

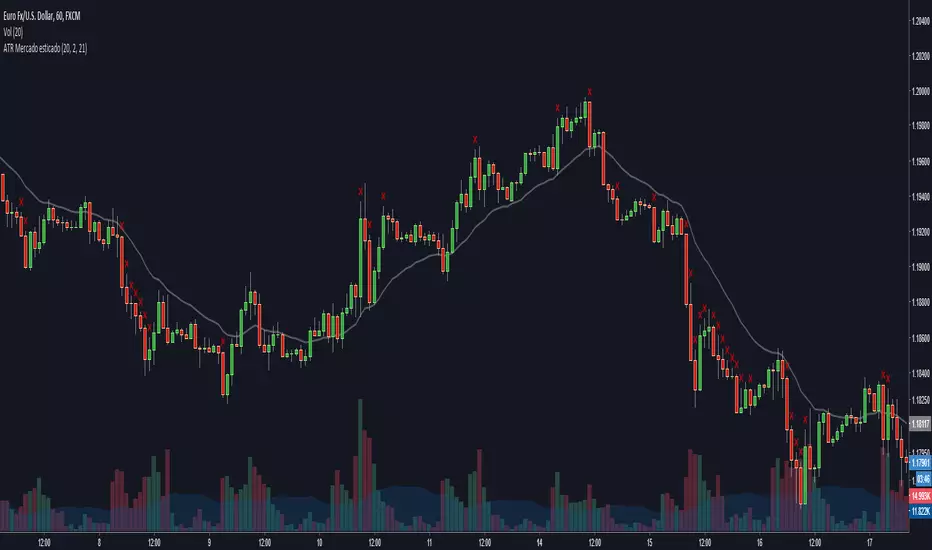
ATR Stretched Market [zauoyds]This indicator verify the close in comparison with EMA21. If the number is higher than 2ATR, the X is ploted above the candle.
Avoid positions when the candle is marked.
The best entries always will be close to the averages.
You can change the values through the inputs, according with your trade system.
Average StretchCalculates the average of the minimum absolute move from either open to high or open to low, over the given number of bars.
