FunctionSurvivalEstimationLibrary "FunctionSurvivalEstimation"
The Survival Estimation function, also known as Kaplan-Meier estimation or product-limit method, is a statistical technique used to estimate the survival probability of an individual over time. It's commonly used in medical research and epidemiology to analyze the survival rates of patients with different treatments, diseases, or risk factors.
What does it do?
The Survival Estimation function takes into account censored observations (i.e., individuals who are still alive at a certain point) and calculates the probability that an individual will survive beyond a specific time period. It's particularly useful when dealing with right-censoring, where some subjects are lost to follow-up or have not experienced the event of interest by the end of the study.
Interpretation
The Survival Estimation function provides a plot of the estimated survival probability over time, which can be used to:
1. Compare survival rates between different groups (e.g., treatment arms)
2. Identify patterns in the data that may indicate differences in mortality or disease progression
3. Make predictions about future outcomes based on historical data
4. In a trading context it may be used to ascertain the survival ratios of trading under specific conditions.
Reference:
www.global-developments.org
"Beyond GDP" ~ www.aeaweb.org
en.wikipedia.org
www.kdnuggets.com
survival_probability(alive_at_age, initial_alive)
Kaplan-Meier Survival Estimator.
Parameters:
alive_at_age (int) : The number of subjects still alive at a age.
initial_alive (int) : The Total number of initial subjects.
Returns: The probability that a subject lives longer than a certain age.
utility(c, l)
Captures the utility value from consumption and leisure.
Parameters:
c (float) : Consumption.
l (float) : Leisure.
Returns: Utility value from consumption and leisure.
welfare_utility(age, b, u, s)
Calculate the welfare utility value based age, basic needs and social interaction.
Parameters:
age (int) : Age of the subject.
b (float) : Value representing basic needs (food, shelter..).
u (float) : Value representing overall well-being and happiness.
s (float) : Value representing social interaction and connection with others.
Returns: Welfare utility value.
expected_lifetime_welfare(beta, consumption, leisure, alive_data, expectation)
Calculates the expected lifetime welfare of an individual based on their consumption, leisure, and survival probability over time.
Parameters:
beta (float) : Discount factor.
consumption (array) : List of consumption values at each step of the subjects life.
leisure (array) : List of leisure values at each step of the subjects life.
alive_data (array) : List of subjects alive at each age, the first element is the total or initial number of subjects.
expectation (float) : Optional, `defaut=1.0`. Expectation or weight given to this calculation.
Returns: Expected lifetime welfare value.
Survival

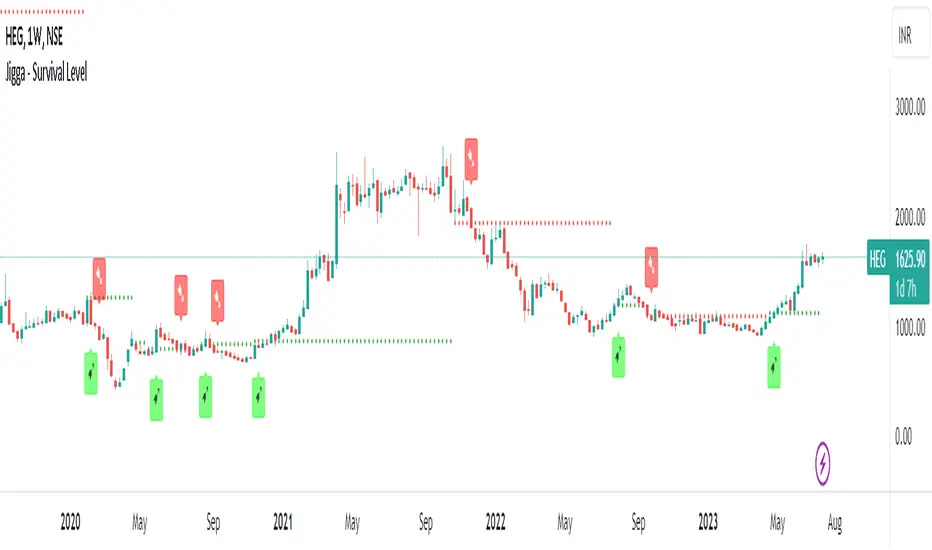
Jigga - Survival LevelHi All !!
Its always the case that we buy a stock and it starts falling !! What a new investor will do is to add few more on downfall and then few more until they stuck all their case to same falling stock.
I thought to create a level which can help long term investor on when to buy and sell.
Logic:
I have used multiple indicators logic all into one and find out when majority of them are showing positive sign.
Green /Red line will be shown when majority are in positive / negative territory.
Buy and sell signal will be generated based on this line only.
Note:
Use this on Weekly chart on good fundamental stock for long term investment.