Multiple AVWAP [OmegaTools]The Multiple AVWAP indicator is a sophisticated trading tool designed for professional traders who require precision in volume-weighted price tracking. This indicator allows for the deployment of multiple Anchored Volume Weighted Average Price (AVWAP) calculations simultaneously, offering deep insights into price movements, dynamic support and resistance levels, and trend structures across multiple timeframes.
This indicator caters to both institutional and retail traders by integrating flexible anchoring methods, multi-timeframe adaptability, and enhanced visualization features. It also includes deviation bands for statistical analysis, making it a comprehensive volume-based trading solution.
Key Features & Functionalities
1. Multiple AVWAP Configurations
Users can configure up to four distinct AVWAP calculations to track different market conditions.
Supports various anchoring methods:
Fixed: A traditional AVWAP that starts from a defined historical point.
Perpetual: A rolling VWAP that continuously adjusts over time.
Extension: An extension-based AVWAP that projects from past calculations.
High Volume: Anchors AVWAP to the highest volume bar within a specified period.
None: Option to disable AVWAP calculation if not required.
2. Advanced Deviation Bands
Implements standard deviation bands (1st and 2nd deviation) to provide a statistical measure of price dispersion from the AVWAP.
Serves as a dynamic method for identifying overbought and oversold conditions relative to VWAP pricing.
Deviation bands are customizable in terms of visibility, color, and transparency.
3. Multi-Timeframe Support
Users can assign different timeframes to each AVWAP calculation for macro and micro analysis.
Helps in identifying long-term institutional trading levels alongside short-term intraday trends.
4. Z-Score Normalization Mode
Option to standardize oscillator values based on AVWAP deviations.
Converts price movements into a statistical Z-score, allowing traders to measure price strength in a normalized range.
Helps in detecting extreme price dislocations and mean-reversion opportunities.
5. Customizable Visual & Aesthetic Settings
Fully customizable line colors, transparency, and thickness to enhance clarity.
Users can modify AVWAP and deviation band colors to distinguish between different levels.
Configurable display options to match personal trading preferences.
6. Oscillator Mode for Trend & Momentum Analysis
The indicator converts price deviations into an oscillator format, displaying AVWAP strength and weakness dynamically.
This provides traders with a momentum-based perspective on volume-weighted price movements.
User Guide & Implementation
1. Configuring AVWAPs for Optimal Use
Choose the mode for each AVWAP instance:
Fixed (set historical point)
Perpetual (rolling, continuously updated AVWAP)
Extension (projection from past AVWAP levels)
High Volume (anchored to highest volume bar)
None (disables the AVWAP line)
Adjust the length settings to fine-tune calculation sensitivity.
2. Utilizing Deviation Bands for Market Context
Activate deviation bands to see statistical boundaries of price action.
Monitor +1 / -1 and +2 / -2 standard deviation levels for extended price movements.
Consider price action outside of deviation bands as potential mean-reversion signals.
3. Multi-Timeframe Analysis for Institutional-Level Insights
Assign different timeframes to each AVWAP to compare:
Daily VWAP (institutional trading levels)
Weekly VWAP (swing trading trends)
Intraday VWAPs (short-term momentum shifts)
Helps identify where institutional liquidity is positioned relative to price.
4. Activating the Oscillator for Momentum & Bias Confirmation
The oscillator converts AVWAP deviations into a normalized value.
Use overbought/oversold levels to determine strength and potential reversals.
Combine with other indicators (RSI, MACD) for confluence-based trading decisions.
Trading Applications & Strategies
5. Trend Confirmation & Institutional VWAP Tracking
If price consistently holds above the primary AVWAP, it signals a bullish trend.
If price remains below AVWAP, it indicates selling pressure and a bearish trend.
Monitor retests of AVWAP levels for potential trend continuation or reversal.
6. Dynamic Support & Resistance Levels
AVWAP lines act as dynamic floating support and resistance zones.
Price bouncing off AVWAP suggests continuation, whereas breakdowns indicate a shift in momentum.
Look for confluence with high-volume zones for stronger trade signals.
7. Mean Reversion & Statistical Edge Trading
Prices that deviate beyond +2 or -2 standard deviations often revert toward AVWAP.
Mean reversion traders can fade extended moves and target AVWAP re-tests.
Helps in identifying exhaustion points in trending markets.
8. Institutional Liquidity & Volume Footprints
Institutions often execute large trades near VWAP zones, causing price reactions.
Tracking multi-timeframe AVWAP levels allows traders to anticipate key liquidity areas.
Use higher timeframe AVWAPs as macro support/resistance for swing trading setups.
9. Enhancing Momentum Trading with AVWAP Oscillator
The oscillator provides a momentum-based measure of AVWAP deviations.
Helps in confirming entry and exit timing for trend-following trades.
Useful for pairing with stochastic oscillators, MACD, or RSI to validate trade decisions.
Best Practices & Trading Tips
Use in Conjunction with Volume Analysis: Combine with volume profiles, OBV, or CVD for increased accuracy.
Adjust Timeframes Based on Trading Style: Scalpers can focus on short-term AVWAP, while swing traders benefit from weekly/daily AVWAP tracking.
Backtest Different AVWAP Configurations: Experiment with different anchoring methods and lookback periods to optimize trade performance.
Monitor Institutional Order Flow: Identify key VWAP zones where institutional traders may be active.
Use with Other Technical Indicators: Enhance trading confidence by integrating with moving averages, Bollinger Bands, or Fibonacci retracements.
Final Thoughts & Disclaimer
The Multiple AVWAP indicator provides a comprehensive approach to volume-weighted price tracking, making it ideal for professional traders. While this tool enhances market clarity and trade decision-making, it should be used as part of a well-rounded trading strategy with risk management principles in place.
This indicator is provided for informational and educational purposes only. Trading involves risk, and past performance is not indicative of future results. Always conduct your own analysis and due diligence before executing trades.
OmegaTools - Enhancing Market Clarity with Precision Indicators
متوسط الأسعار المرجح بحجم التداول

AVWAP CurvesThis indicator calculates and displays Anchored Volume-Weighted Average Price (AVWAP) for the 15-minute, 1-hour, and 4-hour timeframes. It helps identify volume-weighted support/resistance levels and trends based on volume and price data.
Multiple Timeframes: Displays AVWAP curves for 15m, 1h, and 4h. Users can toggle visibility for each timeframe.
Price Anchor Selection: Choose between Low, High, or HL2 as the price anchor for the AVWAP calculation.
Custom Date & Time Anchor: Set a specific start time for the AVWAP calculation.
Alerts: Alerts are triggered when the price crosses above or below any AVWAP curve.

Multi-Timeframe EMA [TradeWithRon]Multi-Timeframe EMA Indicator
This indicator displays an Exponential Moving Average (EMA) from a higher timeframe on a lower timeframe chart. The EMA is a type of moving average that gives more weight to recent prices, making it more responsive to price changes compared to a Simple Moving Average (SMA). By overlaying a higher timeframe EMA on a lower timeframe chart, you can gain insights into the broader trend while analyzing price action at a more granular level.
🔶 FEATURES
* 5 MTF EMA with price and timeframe labels
* Smoothing: Alter the smoothness of the back-end EMA calculations.
* VWAP
Why Use EMA
Trend Identification: When the price is above the EMA, it suggests an uptrend, while a price below the EMA indicates a downtrend. The steeper the slope of the EMA, the stronger the trend.
Crossovers : A common strategy is to look for crossovers, such as when a short-term EMA crosses above a long-term EMA, signaling a potential buying opportunity (bullish crossover), or when a short-term EMA crosses below a long-term EMA, signaling a potential selling opportunity (bearish crossover).
Support and Resistance : EMAs can act as dynamic support and resistance levels. In an uptrend, the price may bounce off the EMA as support, while in a downtrend, it can act as resistance.
Convergence and Divergence: Traders look for divergences between price and the EMA to spot potential trend reversals. For example, if price makes a new high but the EMA doesn't, it could signal weakening momentum.
Overall, the EMA helps traders follow the market trend, spot potential reversals, and make more informed trading decisions.
After EMA Crosses you may experience A MSS, CISD, SFP. You can use all of these as confluence for a higher probability trade. This is a good way to capitalize on a trade
Another Case
How I Personally Use It:
Shortest EMA ( Example: 10 EMA ) = Entry
Middle EMA ( Example: 50 EMA ) = Short Term Support / Resistance
Longest EMA ( Example: 100 EMA ) = Long Term Support / Resistance
• WARNING
- If your MAIN chart TimeFrame its lower than ( selected TimeFrame ) the Table will not display signals
- Historical Data Unavailable for this resolution is under 2 minute chart, So you will have to use 2 minute and higher
🔶 Disclaimer
Use with Caution: This indicator is provided for educational and informational purposes only and should not be considered as financial advice. Users should exercise caution and perform their own analysis before making trading decisions based on the indicator's signals.
Not Financial Advice: The information provided by this indicator does not constitute financial advice, and the creator (Tradewithron) shall not be held responsible for any trading losses incurred as a result of using this indicator.
Backtesting Recommended: Traders are encouraged to backtest the indicator thoroughly on historical data before using it in live trading to assess its performance and suitability for their trading strategies.
Risk Management: Trading involves inherent risks, and users should implement proper risk management strategies, including but not limited to stop-loss orders and position sizing, to mitigate potential losses.
No Guarantees: The accuracy and reliability of the indicator's signals cannot be guaranteed, as they are based on historical price data and past performance may not be indicative of future results.

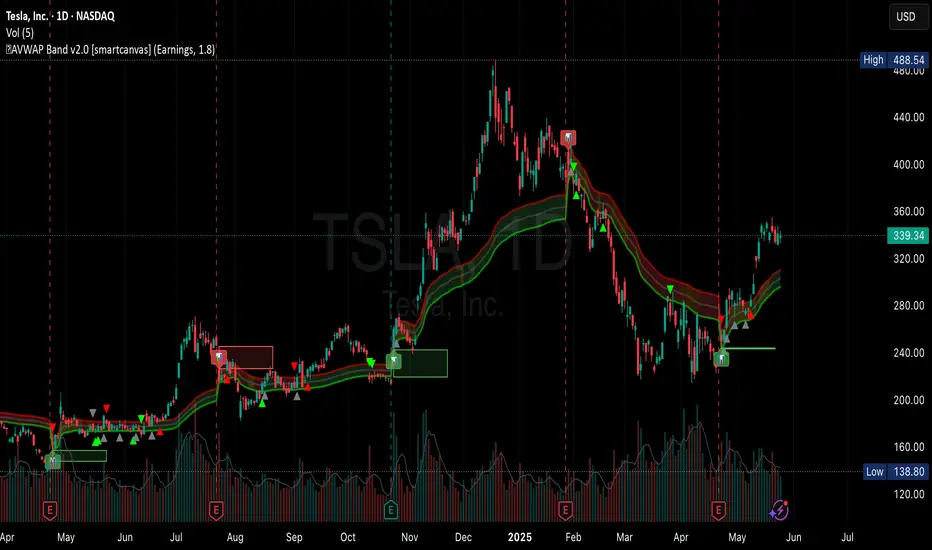
AVWAP Band✨ AVWAP Band by Mars ✨
The AVWAP Band indicator eliminates the guesswork of selecting multipliers for your VWAP analysis. Instead of using arbitrary deviations, this indicator provides three distinct VWAP lines calculated from different price points - giving you a complete VWAP band with just one tool.
What Makes This Different From Standard VWAP
Traditional VWAP indicators use multipliers (1.0, 2.0, 3.0) which require constant adjustment across different markets and timeframes. The AVWAP Band simplifies this by using natural price points:
Low-based VWAP (green) - acts as support
High-based VWAP (red) - acts as resistance
HL2-based VWAP (gray) - acts as the centerline
Key Features
Reduces cognitive load - no more guessing which multiplier to use
User-selected anchor point (click to set date)
Customizable colors and line styles
Built-in alerts for all crossover/crossunder events
Visual anchor point marker
How To Use It
After adding the indicator to your chart, you have to click on your anchor point
Watch for price reactions at each VWAP line
Look for crossovers between price and the different VWAPs
Use the HL2 VWAP as a centerline to determine overall bias
Trading Applications
Support/Resistance levels for intraday trading
Mean-reversion signals when price touches band extremes
Trend confirmation when price holds above/below centerline
Range identification between upper and lower bands
Volatility assessment based on band width
Customization Options
Toggle each VWAP line individually
Adjust line colors to match your chart theme
Control line width and transparency
Enable/disable anchor point label
This indicator simplifies VWAP analysis by giving you natural price-based bands without the need to adjust multipliers across different markets. The high, low, and HL2 sources create a complete VWAP picture with just one tool.
VIDEO
Feedback and suggestions welcome!
ZenAlgo - LevelsThis script combines multiple anchored Volume-Weighted Average Price (VWAP) calculations into a single tool, providing a continuous record of past VWAP levels and highlighting when price has tested them. Typically, VWAP indicators show only the current VWAP for a single anchor period, requiring you to either keep re-anchoring manually or juggle multiple instances of different VWAP tools for each timeframe. By contrast, this script automatically tracks both the ongoing VWAP and previously completed VWAP values, along with real-time detection of “tests” (when price crosses a particular VWAP level). It’s especially valuable for traders who want to see how price has interacted with VWAP over several sessions, weeks, or months—without switching between separate indicators or manually setting anchors.
Below is a comprehensive explanation of each component, why multiple VWAP lines working together can be more informative than a single line, and how to adjust the script for various markets and trading styles:
Primary VWAP vs. Historical VWAP Lines - Standard VWAP indicators typically focus on the current line only. This script also calculates a primary VWAP, but it “locks in” each completed VWAP value when a new time anchor is detected (e.g., new weekly bar, new monthly bar, new session). As a result, you retain an ongoing history of VWAP lines for every completed anchored period. This is more powerful than manually setting up multiple VWAP tools—one for each desired timeframe—because everything is handled in a single script. You avoid chart clutter and the risk of forgetting to reset your manual VWAP at the correct bar.
Why Combine Multiple Anchored VWAP Lines in One Script? - Viewing several anchored VWAP lines together offers synergy . You see not only the current VWAP but also previous ones from different sessions or months, all within the same chart pane. This synergy becomes apparent if multiple historical VWAP lines cluster near the same price level, indicating a potentially significant zone of volume-based support or resistance. Handling this manually would involve repeatedly setting separate VWAP indicators, each reset at specific points, which is time-consuming and prone to error. In this script, the process is automated: as soon as the anchor changes, a completed VWAP line is stored so you can observe how price eventually reacts to it, repeatedly or not at all.
Automated “Test” Detection - Once a historical VWAP line is set, the script tracks when price crosses it in subsequent bars. If the high and low of a bar span that line, the script marks it in red (both the line and its label). It also keeps a counter of how many times each line has been tested. This method goes beyond a simple visual approach by quantifying the retests. Because all these lines are created and managed in one place, you don’t have to manually label the lines or check them one by one.
Advantages Over Manually Setting Multiple VWAPs
You save screen space: Instead of layering several VWAP indicators, each with unique settings, this single script plots them all on one overlay.
Automation: When a new anchor period begins, the script “closes out” the old VWAP and starts a new one. You never need to remember to reset it manually.
Retest Visualization: The script not only draws each line but also changes color and updates the label automatically if a line gets tested. Doing this by hand would be labor-intensive.
Unified Parameters: All settings (e.g., array size, max distance, test count limit) apply uniformly. You can manage them from one place, instead of configuring multiple separate tools.
Extended Insight with Multiple VWAP Lines
Since VWAP reflects the volume-weighted average price for each chosen period, historical lines can show zones where the market had a fair-value consensus in previous intervals. When the script preserves these lines, you see potential support/resistance areas more distinctly. If, for instance, price continually pivots around an old VWAP line, that may reveal a strong volume-based level. With several older VWAP lines on the chart, you gain an immediate sense of where these volume-derived averages have appeared and how price reacted over time. This wider perspective often proves more revealing than a single “current” VWAP line that does not reflect previous anchor sessions.
Handling of Illiquid Markets and Volume Limitations
VWAP is inherently tied to volume data, so its reliability decreases if volume reporting is missing or if the asset trades with very low liquidity. In such cases, a single large trade might momentarily skew the VWAP, resulting in “false” test signals when the high/low range intersects an abnormal price swing. If you suspect the data is incomplete or the market is unusually thin, it’s wise to confirm the validity of these VWAP lines before using them for any decision-making. Additionally, unusual market conditions—like after-hours trading or sudden high-volatility events—may cause VWAP to shift quickly, setting up multiple lines in a short time.
Key User-Configurable Settings
Hide VWAP on Day timeframe and above : Lets you disable the primary VWAP plot on daily or higher timeframes for a cleaner view.
Anchor Period : Select from Session, Week, Month, Quarter, Year, Decade or Century. Controls how frequently the script resets and preserves the VWAP line.
Offset : Moves the current VWAP line by a specified number of bars if you need a shifted perspective.
Max Array Size : Caps how many past VWAP lines the script will remember. Prevents clutter if you’re charting very long histories.
Max Distance : Defines how far back (in bar index units) a line is kept. If a line’s start bar is older than this threshold, it’s removed, keeping the chart uncluttered.
Max Red Labels : Limits the number of tested (red) VWAP lines that appear. If price tests a large number of old lines, only the newest red labels remain once you hit the set limit.
Workflow Overview
As soon as a new anchor period begins (e.g., a new weekly candle if “Week” is chosen), the script ends the current VWAP and stores that final value in its internal arrays.
It creates a dotted line and label representing the completed VWAP, and keeps track of whether it has been tested or not.
Subsequent bars may then cross that line. If a bar’s high/low includes the line’s value, it’s flagged as tested, labeled red, and a test counter increases.
As new anchored periods come, old lines remain visible—unless they fall outside your maxDistance or you exceed the maximum stored line count.
Real-World Benefits
Combining multiple VWAP lines—ranging, for example, from session-based lines for intraday perspectives to monthly or quarterly lines for broader context—provides a layered view of the volume-based fair price. This can help you quickly spot zones where price repeatedly intersects old VWAPs, potentially highlighting where bulls or bears took action historically. Because this script automates the management of all these lines and flags their retests, it removes a great deal of repetitive manual work that would typically accompany multiple, separate VWAP indicators set to different anchors.
Limitations & Practical Use
As with any volume-related tool, the script depends on reliable volume data. Assets trading on smaller venues or during illiquid periods may produce spurious signals. The script does not signal buy or sell decisions; rather, it helps visually map out where volume-weighted averages from previous periods might still be relevant to market behavior. Always combine the insight from these historical VWAP lines with your existing analytical approach or other technical and fundamental tools you use.
Conclusion
This script unifies past and present VWAP lines into one overlay, automatically detecting new anchor resets, storing the final VWAP values, and indicating whenever old lines are retested by price. It offers synergy through the simultaneous display of multiple historical VWAP lines, making it quicker and easier to detect potential support/resistance zones and better reflect changing market volumes over time. You no longer need to manually create, configure, or reset multiple VWAP indicators. Instead, the script handles all aspects of line creation, retest detection, and clutter management, giving you a robust framework to observe how historical VWAP data aligns with current price action.
By understanding the significance of multiple anchored VWAP lines, you can assess market structure from multiple angles in a single view. As always, ensure you confirm the reliability of the volume data for your particular asset and use these lines in conjunction with other analyses to form a well-rounded perspective on current market behavior.

VWAP Horizon Suite Optimized - CoffeeKillerVWAP Horizon Suite Optimized - User Guide
Overview
The VWAP Horizon Suite Optimized is a comprehensive technical analysis tool for TradingView designed to enhance your trading strategy with Volume Weighted Average Price (VWAP) analysis, standard deviation bands, and customizable Exponential Moving Averages (EMAs). This indicator provides a robust framework for identifying potential support and resistance levels, price momentum, and market trends.
Key Features
- **Daily VWAP with Session Reset**: Automatically resets at 17:00 (5:00 PM) each day
- **Customizable Standard Deviation/Percentage Bands**: Up to 3 bands above and below VWAP
- **High/Low Point Detection**: Visual markers for significant price levels
- **Multiple Customizable EMAs**: 8 different EMAs that can be individually toggled and styled
- **Visual Customization**: Adjustable colors, fills, and styles for all elements
VWAP Settings
- **Source**: Determines the price data used to calculate VWAP (default: HLC3 - High, Low, Close average)
Bands Settings
- **Bands Calculation Mode**: Choose between "Standard Deviation" or "Percentage" methods
- **Show Band #1, #2, #3**: Toggle visibility for each band
- **Band Multiplier #1, #2, #3**: Adjust the distance from VWAP (in standard deviations or percentage)
- **Show Fills**: Enable colored fills between bands for better visualization
Visualization Settings
- **Show High/Low Markers**: Display diamond markers for local high and low points relative to VWAP, these reset based on the price crossing the VWAP Line.
EMA Settings
The indicator provides 8 customizable EMAs (8, 13, 21, 26, 48, 50, 100, and 200) with individual controls:
- **Show EMA X**: Toggle visibility for each EMA
- **EMA X Period**: Adjust the period length for calculation
- **EMA X Color**: Customize the color of each EMA
- **EMA Line Width**: Set the width for all EMA lines
How to Use
Basic VWAP Analysis
The core VWAP line (blue) represents the average price weighted by volume since the start of the session (17:00 daily reset). This serves as a dynamic support/resistance level and reference point for intraday trading.
1. **Price above VWAP**: Generally bullish short-term sentiment
2. **Price below VWAP**: Generally bearish short-term sentiment
3. **Crosses of VWAP**: Potential shift in short-term momentum
Standard Deviation Bands
The bands surrounding VWAP help identify potential support, resistance, and volatility levels:
- **Band #1 (±1σ)**: Price often reverts to VWAP when reaching these levels
- **Band #2 (±2σ)**: Stronger support/resistance areas, possible reversal zones
- **Band #3 (±3σ)**: Extreme price levels, often indicating overbought/oversold conditions
High/Low Point Detection
Purple and yellow diamond markers identify significant swing highs and lows relative to VWAP, helping you recognize potential reversal points or continuation patterns. (These repaint in a effort to find the max high/low point from the VWAP Line)
EMA Strategy
The customizable EMAs can be used to:
- Find potential support/resistance levels
- Create crossover systems
- Analyze market structure
Common EMA combinations include:
- 8 & 21 for short-term trends
- 50 & 200 for long-term trends and the "Golden Cross/Death Cross"
- 13 & 48 for the "New Golden Cross" - a modern alternative gaining popularity among traders
- 8, 13, 21 for complex short-term momentum analysis
Advanced Usage Tips
For Day Traders
1. **Opening Range Analysis**: Watch how price reacts to VWAP in the first hour of trading
2. **VWAP Reversions**: Look for trades when price touches outer bands and reverses toward VWAP
3. **Band Breakouts**: Strong moves beyond Band #2 may indicate momentum for continuation
For Swing Traders
1. **Use alongside daily/weekly support-resistance levels**
2. **Combine with EMA crossovers for trend confirmation**
3. **Identify potential reversal zones where price reaches Band #3**
Combined Strategies
- **EMA + VWAP Confluence**: Strong signals occur when EMA lines and VWAP/bands align at the same price level
- **High/Low + Band Touch**: When a high/low marker appears near a band, it may indicate a stronger support/resistance level
Conclusion
The VWAP Horizon Suite Optimized provides a comprehensive set of tools for price analysis based on volume-weighted data and exponential averages. By understanding and properly configuring the various components, you can create a powerful visual framework for identifying potential trading opportunities across multiple timeframes.
Remember that no indicator provides perfect signals, and the VWAP Horizon Suite works best when used as part of a complete trading strategy that includes risk management, multiple confirmation tools, and proper analysis of market conditions.
DISCLAIMER
**DISCLAIMER: This indicator and its signals are intended solely for educational and informational purposes. They do not constitute financial advice. Trading involves significant risk of loss. Always conduct your own analysis and consult with financial professionals before making trading decisions.**

MM Labelled AVWAPTradingView provides a tool to show anchored VWAP plots on your screen, but there is no way to label the plots to add additional context to the level. Instead, users are forced to use the plot style (color, line style, line thickness, etc) to indicate what the plots are for and then they have to remember that meaning when looking at different charts. It also means that for key market-wide moments, users will need to add the plot for every symbol.
Now, for the first time on TradingView, you can create anchored VWAP plots with labels on them so you can understand the meaning behind the key moments you care about and don't need to remember what they mean by using styles like color or thickness. You can use this indicator to track key moments like the 2022 market bottom, or the Aug 9, 2024 "Carry Trade Unwind" bottom. The labelled AVWAP plots are visible on every chart by default. If you have an AVWAP moment that is only relevant to a small number of symbols, you can configure the indicator to only appear on those symbols.

VWAP & Volume Correlation### **Calculating the Correlation Between VWAP (Volume-Weighted Average Price) and Volume (VOLUME) Over a Period of Time**
#### **Breakdown & Understanding**
- **VWAP (Volume-Weighted Average Price)**: Similar to an average price but weighted by volume, representing the average price at which market participants traded during a specific period.
- **VOLUME (Trading Volume)**: The total amount of assets traded over a certain period.
- **CORR (Correlation)**: Measures the relationship between two variables, ranging from **-1 to 1**:
- **Close to 1**: VWAP and volume **move in sync**—when volume increases, VWAP also rises, and when volume decreases, VWAP also falls.
- **Close to -1**: VWAP and volume **move inversely**—when volume increases, VWAP decreases, and vice versa.
- **Close to 0**: No significant relationship between VWAP and volume.
#### **Examples**
- If the correlation is **high (close to 1)**, it indicates that an increase in trading volume leads to a higher VWAP, suggesting that large amounts of capital are being traded at higher prices, which could indicate a **strong market**.
- If the correlation is **low (close to 0)**, it suggests that there is **no stable relationship** between VWAP and volume.
- If the correlation is **close to -1**, it means that **higher trading volume leads to a lower VWAP**, possibly indicating that heavy selling pressure is pushing prices down.
#### **Practical Applications**
- **Identifying Market Trends**: If VWAP and volume have a strong correlation, it could indicate that the current trend is stable.
- **Detecting Anomalies**: If the correlation suddenly drops or turns negative, it may signal a shift in market behavior, such as **large-scale selling or sudden price surges**.
#### **How to Use This Indicator**
- **When the correlation is close to 1 (Blue)**:
- VWAP and volume are moving **in sync**, suggesting a stable market trend.
- **When the correlation is close to -1 (Red)**:
- **Higher volume is causing VWAP to drop**, which could indicate institutional distribution or unusual market movements.
- **When the correlation fluctuates significantly**:
- It suggests **market sentiment is changing**, and it may be worth watching for a potential trend reversal.
By monitoring VWAP and volume correlation, traders can **better understand market conditions, detect institutional activity, and refine their trading strategies**. 🚀

WAVES II by WestmontWAVES II by Westmont is a next-generation evolution of the original WAVES indicator, designed to offer improved responsiveness , enhanced functionality , and clearer visual clarity . By incorporating advanced momentum filtering and smoother transitions in the VWAP (Volume Weighted Average Price) area , WAVES II provides users with a more dynamic and actionable tool for market analysis.
This indicator introduces new methodologies , visual enhancements , and advanced forecasting capabilities , making it an ideal tool for traders seeking faster insights and sharper reactions to market movements.
Key Features of WAVES II
WaveTrend Calculation
The core of WAVES II is the WaveTrend , which is calculated using the HLC3 (High + Low + Close) price .
The WaveTrend is smoothed through two processes:
EMA (Exponential Moving Average): Applied to the HLC3 to capture faster price movements .
SMA (Simple Moving Average): Applied to the first wave to smooth out shorter-term fluctuations.
VWAP Area Crossover
WAVES II calculates the VWAP area by subtracting the second wave from the first .
The indicator detects when this VWAP area crosses key levels :
Bullish Signal : When the VWAP area crosses upward with positive momentum.
Bearish Signal : When the VWAP area crosses downward with negative momentum.
Momentum Detection
Momentum is calculated by measuring the price change between bars and smoothing this change over a short period .
Positive momentum signals increasing price movement , while negative momentum indicates a slowing or reversing trend .
This momentum detection filters out weaker price movements , highlighting only the significant trend shifts and giving users confirmation of market movements.
Visual Enhancements
Glowing VWAP Lines : The VWAP area is plotted with multiple layers of colors, gradually fading in opacity. This highlights areas of strong price movement and reversals.
Fading Gradient Effect : The VWAP line is filled with a gradient that adjusts its opacity based on the distance from the center line, visually indicating market strength and reinforcing key levels.
VWAP Projection
WAVES II projects the VWAP area forward , based on its recent slope, to offer a forward-looking view of potential price movements. This projection helps traders anticipate short-term market direction and react faster to potential trend changes.
Key Differences Between WAVES and WAVES II
Smoothing and WaveTrend Calculation Adjustments
WAVES : Uses fixed smoothing parameters for WaveTrend calculation, resulting in a relatively stable and slower response to market changes.
The first smoothing (wavetrend1) uses an EMA with a fixed length.
The second smoothing (wavetrend2) uses a simple moving average (SMA) with a fixed length.
WAVES II : Introduces more responsive settings like smoothing_length, deviation_length, first_wave_length, and second_wave_length for faster reaction times to market movements. These adjustments make WAVES II ideal for traders who need quicker feedback and sharper market transitions.
Momentum Detection
WAVES : Does not incorporate momentum-based logic, relying only on the VWAP area and its relationship to historical values.
WAVES II : Adds momentum detection, which calculates the difference between current and previous price movements, smoothed over a defined period. This helps identify bullish and bearish trends more accurately, providing additional confirmation and improving signal reliability.
VWAP Area Cross Detection
WAVES : Detects VWAP area crossovers based on recent high and low values.
WAVES II : Refines cross detection by incorporating a momentum filter. A Bullish cross is confirmed when the VWAP area crosses upwards with positive momentum, while a Bearish cross is confirmed when it crosses down with negative momentum. This dual-condition approach enhances signal accuracy and offers better context for trade decisions.
Plotting and Visualization
WAVES : Plots the VWAP line, center line, and uses color transitions for VWAP area fills to represent market conditions.
WAVES II : Introduces a multi-layer glow effect for the VWAP line, with varying opacities, creating a visually dynamic experience. The gradient glow effect provides a clearer representation of market strength and proximity to the center line, making it easier to spot market shifts and interpret momentum at a glance.
Why WAVES II Was Created as a Separate Indicator
New Features and Functionality :
WAVES II introduces key features like momentum detection and VWAP projections , which significantly alter how the indicator operates. These are not minor updates but represent a shift in how the tool functions , providing faster and more detailed insights for traders. WAVES II gives traders sharper market feedback with improved responsiveness to price changes.
Targeted for Different Trading Styles :
WAVES II is aimed at traders who need faster reactions and more dynamic , reliable signals . While WAVES remains a solid choice for those who prefer a more stable, traditional approach, WAVES II caters to traders who require quicker feedback and more granular market insights. By offering both tools, traders can select the one that aligns with their style, whether that’s for faster decision-making or a more conservative approach .
Visual Clarity :
The enhanced visual effects in WAVES II, such as the multi-layer glow and gradient VWAP transitions , offer greater clarity and a more intuitive charting experience . These visual improvements allow traders to quickly interpret changes in the market, making WAVES II a more effective tool for detailed and actionable market analysis.
Clear Value for Traders :
WAVES II brings significant enhancements over the original WAVES, including more advanced features , faster momentum detection , and better visual representation of market dynamics . This makes WAVES II a more powerful tool for traders seeking dynamic market insights . It is an ideal choice for those who need quicker and more reliable feedback than traditional tools can provide.
How to Use WAVES II
Users can watch for WaveTrend crossovers (when the line crosses 0) and VWAP area dots (bullish or bearish) to spot potential buy or sell signals.
Users can use momentum to confirm signals, helping you identify whether the market is gaining or losing strength.
WAVES II offers advanced features , faster responsiveness , and clearer visuals compared to the original WAVES indicator. By introducing momentum detection and refining the handling of VWAP crossovers , WAVES II enhances the overall trading experience, providing more dynamic, actionable insights for traders. While WAVES remains an excellent tool for those who prefer a simpler, more stable approach, WAVES II is designed for traders who seek a more detailed , faster-reacting tool for market analysis.

WAVES by WestmontWAVES by Westmont is a trading indicator that combines WaveTrend analysis with VWAP dynamics to provide traders with insights into market momentum , volatility , and trends . Users can rely on this tool to help identify market shifts , potential trend reversals , and momentum changes . The script integrates custom logic with standard public domain functions to enhance signal accuracy and market analysis.
WAVES builds on familiar tools, such as the Exponential Moving Average ( EMA ), Simple Moving Average ( SMA ), and basic fractal analysis , to create a comprehensive view of price behavior. Users can interpret this indicator to gain a clearer picture of market conditions, utilizing both WaveTrend’s trend-following signals and VWAP’s volume-weighted price reference.
How the Components Work Together:
Divergence Functions
WAVES uses the bottom_fractal and bot_fractal functions to detect local highs and lows, helping identify potential reversal points in the market. These functions work alongside the WaveTrend and VWAP analysis to confirm or challenge potential turning points.
WaveTrend Calculation
ESA (Exponential Smoothing Average): Provides a smoothed base for price direction.
DE (Deviation): Measures volatility, indicating how much price is fluctuating.
CI (Commodity Channel Index): Tracks cycles between price and the smoothed ESA, identifying potential price shifts.
These values are smoothed using EMA and SMA for greater stability. Users can rely on these smoothed signals to reduce noise and improve trend clarity.
VWAP Area Calculation
Users can observe the VWAP area , calculated from the difference between two WaveTrend lines ( wavetrend1 and wavetrend2 ), to understand market equilibrium in relation to volume-weighted price action. The VWAP area provides a clearer picture of price movement relative to market volume.
Signal Dots and Visualization
Bullish Signals: Users can look for blue dots when the VWAP area crosses upwards , indicating that price is above the VWAP and suggesting upward momentum .
Bearish Signals: Users can look for purple dots when the VWAP area crosses downwards , indicating that price is below the VWAP and suggesting downward momentum .
Smooth VWAP Gradient Fill
Users can visually track momentum using the smooth gradient fill between the VWAP plot and the center line . The fill color changes from blue ( positive momentum ) to purple ( negative momentum ), and turquoise ( neutral ), helping traders quickly assess market sentiment and trend strength.
How to Use WAVES by Westmont :
Bullish Momentum : Users can look for blue dots when the VWAP area crosses upward . This suggests the market is in an uptrend as price moves above the VWAP , potentially indicating upward price action .
Bearish Momentum : Users can look for purple dots when the VWAP area crosses downward . This suggests the market is in a downtrend as price moves below the VWAP , indicating potential for downward price action .
Neutral Market Conditions : Users can observe when the VWAP area remains near the center line ( turquoise ), indicating market consolidation or indecision .
Code Usage :
The indicator uses TradingView’s built-in functions (EMA, SMA, and fractals), which are well-optimized for standard technical analysis. These functions serve as a foundation for the indicator’s calculations. Users can trust that the public domain functions ensure efficient performance, while the added customizations enhance signal quality by integrating WaveTrend and VWAP dynamics.

Heatmap Suite [PhenLabs]📊 Heatmap Suite
Version: PineScript™ v6
📌 Description
The Heatmap Suite is an advanced technical analysis tool that combines multiple density calculation methods with dynamic visualization to identify significant price levels and trading activity zones. It features a sophisticated analysis system that processes price and volume data through various kernel methods, providing traders with insights into market structure, support/resistance zones, and potential price reaction areas.
🚀 Points of Innovation:
Multi-method density calculation incorporating three distinct approaches
Adaptive visualization system with dynamic color gradients
Real-time dashboard with key market metrics
Significant level detection with automatic threshold adjustment
🚨 Important🚨
🔸Comprehensive tooltips included in the PhenLabs dashboard for in depth guidance
🔧 Core Components
Density Analysis: Multiple calculation methods for price distribution assessment
Heat Mapping: Dynamic visualization of price congestion zones
Level Detection: Automatic identification of significant price levels
Dashboard System: Real-time market metrics and analysis
🔥 Key Features
The indicator provides comprehensive analysis through:
Kernel Density: Traditional balanced view of price distribution
Exponential Kernel: Time-weighted analysis emphasizing recent price action
Volume-Weighted: Focus on high-volume price areas
Significant Levels: Automatic detection of important price zones
Heat Distribution: Color-coded visualization of price congestion
🎨 Visualization
Heat Zones: Shows intensity of price activity
Significant Lines: Key level indicators
Color Gradients: Indicates density strength
Dashboard Display: Real-time metrics
Dynamic Opacity: Reflects density intensity
📖 Usage Guidelines
The indicator offers several customization options:
Basic Settings:
Calculation Method: Choose between three density calculation approaches
Lookback Period: Analysis timeframe adjustment
Zone Count: Price range division granularity
Heat Sensitivity: Contrast adjustment for visualization
🎛️ Visual Settings:
Dashboard Size: Text size customization
Position: Dashboard placement options
Color Scheme: Heat map gradient visualization
Level Display: Significant price zone indicators
✅ Best Use Cases:
Identify strong support/resistance zones through high-density areas
Spot potential price reversal zones at significant levels
Analyze price congestion patterns
Monitor real-time changes in market structure
⚠️ Limitations
Requires sufficient historical data
Computational intensity increases with longer lookback periods
Heat sensitivity needs adjustment based on market conditions
Dashboard placement may need adjustment based on price action
💡 What Makes This Unique
Multi-method Analysis: Three distinct calculation approaches
Adaptive Visualization: Dynamic color gradient system
Real-time Metrics: Comprehensive dashboard display
Automatic Level Detection: Significant price zone identification
Memory-efficient Design: Optimized calculation methods
🔬 How It Works
The indicator processes market data through four main components:
1. Density Calculation:
Processes price and volume data
Applies selected kernel method
Generates density distribution
2. Heat Mapping:
Converts density values to color gradients
Updates visualization in real-time
Displays price congestion zones
3. Level Detection:
Identifies significant price levels
Applies threshold filtering
Marks important zones
4. Dashboard Updates:
Calculates real-time metrics
Updates display components
Provides market context
💡Note:
The indicator performs best with adequate historical data and proper sensitivity settings. Its sophisticated density analysis provides valuable insights into market structure beyond traditional support/resistance indicators.

Multi-Timeframe VWAP Master ProThe Multi-Timeframe VWAP Suite is a comprehensive and highly customizable indicator designed for traders who rely on Volume-Weighted Average Price (VWAP) across multiple timeframes and periods. This tool provides a complete suite of VWAP calculations, including daily, weekly, monthly, quarterly, yearly, and custom VWAPs, allowing traders to analyze price action and volume trends with precision. Whether you're a day trader, swing trader, or long-term investor, this indicator offers unparalleled flexibility and depth for your trading strategy.
Multi-Timeframe VWAPs:
Daily, Weekly, Monthly, Quarterly, and Yearly VWAPs: Track VWAP across various timeframes to identify key support and resistance levels.
Customizable Timeframes: Use the SMA timeframe input to adjust the period for moving averages and other calculations.
Previous Period VWAPs:
Previous Daily, Weekly, Monthly, and Quarterly VWAPs: Analyze historical VWAP levels to understand past price behavior and identify potential reversal zones.
Previous Year Quarterly VWAPs: Compare current price action to VWAP levels from specific quarters of the previous year.
Custom VWAPs:
Custom Start Date and Timeframe: Define your own VWAP periods by specifying a start date and timeframe, allowing for tailored analysis.
Dynamic Custom VWAP Calculation: Automatically calculates VWAP based on your custom inputs, ensuring flexibility for unique trading strategies.
Seasonal and Yearly VWAPs:
April, July, and October VWAPs: Analyze seasonal trends by tracking VWAP levels for specific months.
Yearly VWAP: Get a broader perspective on long-term price trends with the yearly VWAP.
SMA Integration:
SMA Overlay: Combine VWAP analysis with a Simple Moving Average (SMA) for additional confirmation of trends and reversals.
Customizable SMA Length and Timeframe: Adjust the SMA settings to match your trading style and preferences.
User-Friendly Customization:
Toggle Visibility and Labels: Easily enable or disable the display of specific VWAPs and their labels to keep your chart clean and focused.
Color Customization: Each VWAP line and label is color-coded for easy identification and can be customized to suit your preferences.
Dynamic Labeling:
Automatic Labels: Labels are dynamically placed on the last bar, providing clear and concise information about each VWAP level.
Customizable Label Text: Labels include detailed information, such as the timeframe or custom period, for quick reference.
Flexible Timeframe Detection:
Automatic Timeframe Detection: The indicator automatically detects new days, weeks, months, and quarters, ensuring accurate VWAP calculations.
Support for Intraday and Higher Timeframes: Works seamlessly on all chart timeframes, from 1-minute to monthly charts.
Previous Year Quarterly VWAPs:
Q1, Q2, Q3, Q4 VWAPs: Compare current price action to VWAP levels from specific quarters of the previous year.
User-Selectable Year: Choose the year for which you want to calculate previous quarterly VWAPs.
Persistent Monthly VWAPs:
Option to Persist Monthly VWAPs Year-Round: Keep monthly VWAP levels visible even after the month ends for ongoing analysis.
Comprehensive Analysis: Combines multiple VWAP timeframes and periods into a single tool, eliminating the need for multiple indicators.
Customizable and Flexible: Tailor the indicator to your specific trading strategy with customizable timeframes, periods, and settings.
Enhanced Decision-Making: Gain deeper insights into price action and volume trends across different timeframes, helping you make more informed trading decisions.
Clean and Organized Charts: Toggle visibility and labels to keep your chart clutter-free while still accessing all the information you need.
Ideal For:
Day Traders: Use daily and intraday VWAPs to identify intraday support and resistance levels.
Swing Traders: Analyze weekly and monthly VWAPs to spot medium-term trends and reversals.
Long-Term Investors: Leverage quarterly and yearly VWAPs to understand long-term price behavior and key levels.
Seasonal Traders: Track April, July, and October VWAPs to capitalize on seasonal trends.
The Multi-Timeframe VWAP Suite is a powerful and versatile tool for traders of all styles and timeframes. With its comprehensive suite of VWAP calculations, customizable settings, and user-friendly design, it provides everything you need to analyze price action and volume trends with precision and confidence. Whether you're looking to fine-tune your intraday strategy or gain a broader perspective on long-term trends, this indicator has you covered.

Value Area - Day Trading SuiteValue Area Day Trading Suite
A professional-grade indicator designed specifically for day traders who utilize Volume Profile and Auction Market Theory. This suite provides tracking of previous day's value areas, helping traders identify how current price interacts with these established institutional levels.
It tracks how much time has spent within the value area without Level to Help Measure Acceptance
Key Features
- Previous Day's Value Area tracking (VAH, POC, VAL)
- Precise time-in-value-area measurement
- Cash session integration with major market timezones
- Value Area acceptance alerts
Trading Applications
Perfect for day traders who:
- Trade using previous day's Volume Profile levels
- Focus on institutional price acceptance/rejection
- Trade market structure using confirmed value areas
- Want to automate their value area analysis
- Trade during specific market sessions
Value Area Analysis
The indicator tracks how long price stays within the previous day's value area, helping traders:
- Identify Potential Support / Resistance Levels
- Spot acceptance of established levels
- Find high-probability trading opportunities
- Time their entries and exits more effectively
Professional Tools
- Customizable cash session times for different markets
- Multiple timezone support
- Flexible dashboard positioning
- Clean, professional appearance with adjustable colors
- Alert system for value area acceptance
Built for day traders who utilize value areas

RVMM IndicatorRVMM Indicator
RVMM Indicator combines four indicators: RSI, VWAP, MFI, and Momentum to provide comprehensive technical analysis. This indicator helps traders identify potential market conditions based on the interaction of these indicators.
Components of the RVMM Indicator
1. RSI (Relative Strength Index)
RSI is a momentum indicator that measures the speed and change of price movements. RSI oscillates between 0 and 100 and is used to identify overbought and oversold conditions in the market.
Buy Level: Set at 30. When RSI falls below 30, the market is considered oversold, which may suggest a potential upward trend reversal.
Sell Level: Set at 70. When RSI rises above 70, the market is considered overbought, which may suggest a potential downward trend reversal.
2. VWAP (Volume Weighted Average Price)
VWAP is an indicator that combines price and volume to calculate the average price weighted by volume. VWAP is used to identify support and resistance areas and assess the strength of price movements.
Interpretation: If the price is above the VWAP line, the market is likely in an uptrend. If the price is below the VWAP line, the market is in a downtrend.
3. MFI (Money Flow Index)
MFI is a momentum indicator that considers both price and volume. MFI oscillates between 0 and 100 and is used to identify overbought and oversold conditions in the market.
Oversold Level: Set at 20. When MFI falls below 20, the market is considered oversold.
Overbought Level: Set at 80. When MFI rises above 80, the market is considered overbought.
4. Momentum
Momentum is an indicator that measures the speed of price changes. This indicator is used to identify the strength of a trend.
Interpretation: High momentum values indicate a strong uptrend, while low momentum values indicate a strong downtrend.
How to Use the RVMM Indicator
Interpreting Market Conditions:
RSI : Check RSI values below 30 to identify oversold conditions, and above 70 to identify overbought conditions.
VWAP : Observe whether the price is above or below the VWAP line to determine if the market is in an uptrend or downtrend.
MFI : Check if MFI is below 20 to identify oversold conditions, and above 80 to identify overbought conditions.
Momentum : Analyze momentum values to gauge the strength of the current trend.
Confirming Market Conditions:
Use VWAP, MFI, and Momentum to confirm market conditions identified by RSI.
If the price is above the VWAP line, and MFI and Momentum indicate the strength of the uptrend, the market may be in a bullish phase.
If the price is below the VWAP line, and MFI and Momentum indicate the strength of the downtrend, the market may be in a bearish phase.
Risk Management:
Set stop-loss and take-profit levels based on technical analysis and your trading preferences.
Monitor the market and adjust stop-loss and take-profit levels as market conditions change.
Example of Application
Here is an example of how to use the RVMM Indicator in practice:
Bullish Phase: When the price is above the VWAP line, RSI is below 30, and MFI and Momentum indicate the strength of the uptrend, the market is likely in a bullish phase.
Bearish Phase: When the price is below the VWAP line, RSI is above 70, and MFI and Momentum indicate the strength of the downtrend, the market is likely in a bearish phase.

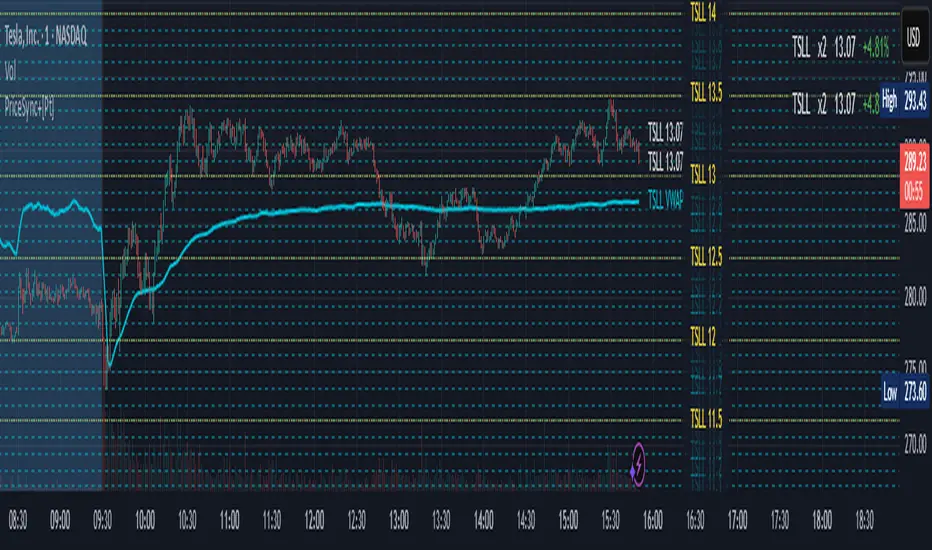
Price Sync Mapper+ [Pt]█ Description:
Price Sync Mapper is a robust TradingView indicator designed to plot correlated price levels of related assets onto the primary chart. This tool is particularly useful for traders who want to trade one asset while monitoring the price action and key levels on another correlated asset, such as leveraged ETFs, inverse ETFs , and other correlated trading pairs. By mapping the price levels of one asset onto another, traders can gain insights into relative price movements and potential trading opportunities.
█ Key Features:
► Multiple Asset Mapping: Supports mapping up to two different tickers onto the primary chart, each with customizable settings, including leverage and inverse properties.
► Dynamic Price Levels: Define the number of price levels to map based on the price movements of the correlated asset, with the scale defined by the multiplier setting.
► VWAP Integration: Option to display Volume Weighted Average Price (VWAP) lines for each mapped ticker, providing additional context on average trading prices. Users can also choose to smooth the VWAP line with a moving average.
► Custom Target Levels: Set and display custom price targets with detailed labels, allowing visualization of key price levels for trading strategies. Users can define labels, tickers, and offsets for up to 8 custom price targets.
► Flexible Update Frequency: Choose to update the indicator on every tick or at the close of each candle, providing flexibility based on trading style and preferences.
► Extended Hours Highlighting: Option to highlight extended trading hours sessions, helping to differentiate between regular and extended trading periods.
► Price Change Display: Displays the percentage price change for each mapped ticker, providing quick insights into the relative performance of correlated assets.
► Table Display: Option to show a table with the current prices, leverage factors, and percentage changes of the mapped tickers, enhancing overall usability and information accessibility. The table can be positioned at various locations on the chart and its font size can be customized.
█ Usage Examples:
► Example 1:
Map the price levels of the Direxion Daily TSLA Bull 2X Shares (TSLL) onto the primary chart of Tesla Inc. (TSLA). This allows traders to see how the leveraged ETF's price movements align with the underlying stock, providing insights into potential trading opportunities based on leverage effects.
► Example 2:
Trade ProShares UltraPro Short QQQ (SQQQ) price levels on Invesco QQQ Trust (QQQ). By mapping the inverse 3x leveraged ETF's price levels onto the underlying asset, traders can set their targets directly on the QQQ chart without flipping between charts and 'guess-timate' which level correspond to which level.
█ Cautionary Note:
Price mapping may not work properly during extended trading hours due to lack of price data, and different trading dynamics and volume.
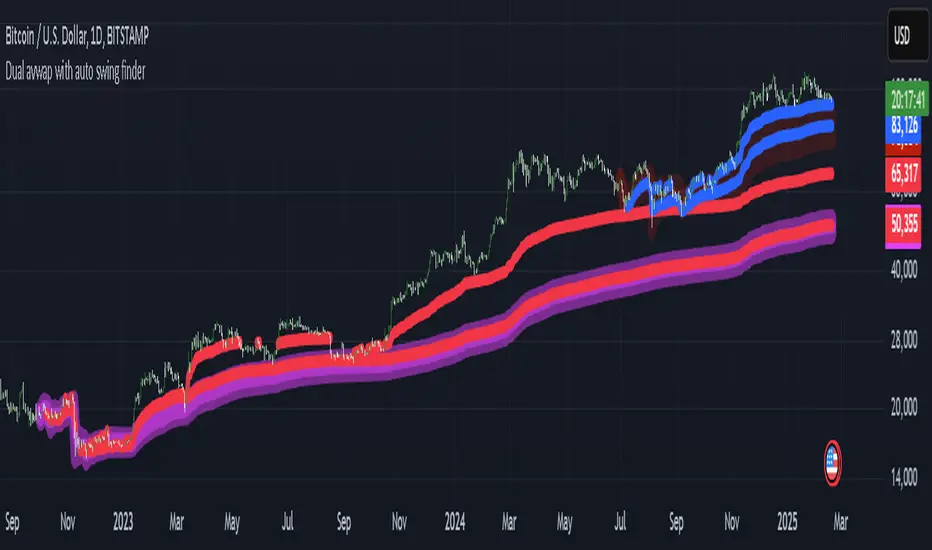
My auto dual avwap with Auto swing low/pivot low finderWelcome to My Auto Dual AVWAP with Auto Swing Low/Pivot Low Finder – an open-source TradingView indicator designed to enhance your technical analysis toolbox. This indicator is published under the Mozilla Public License 2.0 and is available for anyone to study, modify, and distribute.
Key Features
Auto Pivot/Swing Low Finder:
In addition to VWAP lines, the indicator incorporates an automatic detection mechanism for swing lows/pivot lows. This feature assists in identifying potential support areas and price reversals, further enhancing your trading strategy.
Dual VWAP Calculation with high/low range:
The indicator calculates two separate volume-weighted average price (VWAP) lines based on different price inputs (low and high prices) and defined time sessions. This allows traders to gain a more nuanced view of market activity during specific trading periods.
Customizable Time Sessions:
You can specify distinct start and end times for each VWAP calculation session. This flexibility helps you align the indicator with your preferred trading hours or market sessions, making it adaptable to various time zones and trading styles.
Easy to Customize:
With clear code structure and detailed comments, the script is designed to be accessible even for traders who want to customize or extend its functionality. Whether you're a seasoned coder or just starting out, the code is written with transparency in mind.
How It Works
Session Initialization:
The script sets up two distinct time sessions using user-defined start and end times. For each session, it detects the beginning of the trading period to reset cumulative values.
Cumulative Calculations:
During each session, the indicator accumulates the product of price and volume as well as the total volume. The VWAP is then computed as the ratio of these cumulative values.
Dual Data Sources:
Two separate data inputs (using low and high prices) are used to calculate two VWAP lines. This dual approach provides a broader perspective on market trends and can help in identifying dynamic support and resistance levels.
Visualization:
The calculated VWAP lines are plotted directly on your chart with distinct colors and thickness settings for easy visualization. This makes it simple to interpret the data at a glance.
Why Use This Indicator?
Whether you are a day trader, swing trader, or simply looking to refine your market analysis, My Auto Dual AVWAP with Auto Swing Low/Pivot Low Finder offers a robust set of features that can help you identify key price levels and improve your decision-making process. Its open-source nature invites collaboration and customization, ensuring that you can tailor it to fit your unique trading style.
Feel free to explore, modify, and share this indicator. Happy trading!
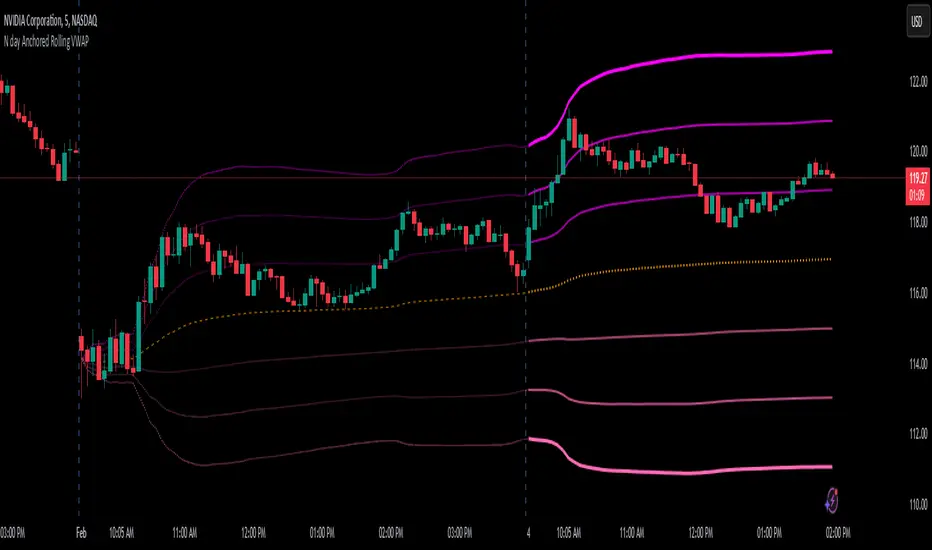
N day Anchored Rolling VWAP
⭐ Overview
The N-Day Anchored Rolling VWAP is designed to automate and simplify the use of anchored VWAP for traders, making it an invaluable tool for those who rely on VWAP for trend filtering, support/resistance identification, or strategy implementation. This indicator removes the tedious and repetitive manual process of setting the anchored VWAP for multiple charts or stocks in a watchlist. Once added, the indicator dynamically maintains and updates the anchor point across charts, allowing users to focus on their analysis instead of time-consuming adjustments.
________________________________________
⭐ Goal of the Indicator
The primary goal of this indicator is to automate the manual process of anchoring the VWAP for multiple charts or stocks. By removing the need to manually set the anchor every day, this script simplifies the workflow and saves valuable time for traders.
The examples and chart illustrations provided showcases some of the most common and widely used ways traders utilize anchored VWAP in their strategies. They are intended as demonstrations, not exhaustive applications, as specific use cases may vary based on individual trading approaches.
________________________________________
⭐ Why the Name?
1).N-Day Anchored:
The term "N-Day Anchored" reflects the flexibility of the anchor point. Users can specify the number of days prior to the present day where the VWAP calculation should begin. For
example:
🟢"0" anchors the VWAP to the current day's opening.
🟢"1" anchor it to the previous day's opening.
🟢"2" anchors it to the day before yesterday, and so on.
2).Rolling:
The "Rolling" aspect signifies that the anchor point remains consistent relative to the current day. For instance:
If the anchor is set to the day before yesterday, the indicator will continuously adjust to
ensure the anchor remains two days prior, even as new trading days begin. This means the
lines plotted always reflect the VWAP anchored to the chosen
relative day, regardless of how many days have passed.
________________________________________
⭐ Inputs, Settings, and Functionality
1). Anchor Point (Days Prior): Use the "Days prior" input to set the anchor point for VWAP:
🟢"0": Anchors the VWAP to the start of the current day's trading session.
🟢"1": (default): Anchors the VWAP to the start of the previous day's trading session.
🟢"2": Anchors the VWAP to the day before yesterday, and so on.
This input determines the starting point for the VWAP calculation and updates dynamically each day.
2). VWAP Line Customization: The orange dashed line represents the anchored VWAP.
You can adjust its color through the input’s menu.
3). Standard Deviation Bands:
⭕ Three Bands: The indicator plots three upper and three lower bands to represent standard deviation levels from the VWAP.
➡️ On the current day, these bands are plotted as thick, solid lines with bright colors, providing clear real-time plotting.
➡️ On historical days, the bands appear as faint, dotted lines, offering a visual
representation of the anchored VWAP without cluttering the chart.
⭕ Customizable Settings:
➡️Multiplier: Set the distance of each band from the VWAP.
➡️Colors: Choose separate colors for the upper and lower bands.
➡️Visibility Toggle: Enable or disable specific bands as needed.
This clear differentiation ensures traders can easily distinguish between real-time plotting (current day) and the visualization of historical anchoring.
________________________________________
⭐ Example Use Cases
1). Trend Filter: Use the anchored VWAP as a trend filter:
➡️When the price is above the anchored VWAP, the trend is bullish.
➡️When the price is below the anchored VWAP, the trend is bearish.
2). 2-Day Anchored VWAP Strategy: This strategy uses the VWAP anchored to the
previous day’s opening candle, continuing through today’s price action. Traders can
identify entry and exit points based on how the price interacts with this 2-day anchored VWAP.
3). Standard Deviation Bands as Support or Resistance: Utilize the standard deviation
bands to find potential support and resistance levels, as prices often react near these
bands.
4). VWAP Rejection (VWAP Bounce): Look for rejections near the anchored VWAP to
confirm a continuation of the current trend. For example, if the price rejects the 2-day
anchored VWAP, it can signal a strong continuation in the current trend direction.
Anchored VWAPAnchored VWAP with 3 Standard Deviation Bands
📈 Version: Pine Script v5
📌 Author: Aymen Haddaji
🔍 Overview
This indicator calculates an Anchored Volume-Weighted Average Price (AVWAP), allowing traders to anchor the VWAP calculation from a user-defined date and time. It also plots three standard deviation bands above and below the AVWAP to help identify potential areas of overbought and oversold conditions.
📊 Features & Functionality
✔ Custom Anchor Point: Select a specific date and time to start the AVWAP calculation.
✔ OHLC/4 Calculation: Uses the average of Open, High, Low, and Close to smooth the price input.
✔ Three Standard Deviation Bands:
1st Deviation (Green): Moderate volatility zone.
2nd Deviation (Orange): High volatility zone.
3rd Deviation (Red): Extreme overbought/oversold areas.
✔ Real-Time Calculation: Updates dynamically with each price movement.
✔ Clear Visuals:
AVWAP (Blue Line) represents the fair market price from the anchor.
Deviation Bands (Dashed Lines) show potential support and resistance levels.
🛠 How It Works
VWAP Calculation
Uses a cumulative sum of price × volume divided by cumulative volume.
Calculation starts from the user-defined anchor time.
Standard Deviation Bands
Measures the price dispersion around the AVWAP.
The wider the bands, the higher the volatility.
When price touches or exceeds the 3rd deviation, a potential reversal zone is indicated.
Trading Strategies with AVWAP & Deviation Bands
Trend Confirmation:
Price above AVWAP = Uptrend (bullish).
Price below AVWAP = Downtrend (bearish).
Support & Resistance:
AVWAP acts as dynamic support or resistance.
1st & 2nd deviations often act as secondary levels.
Mean Reversion Trading:
When price reaches the 3rd standard deviation, a pullback is likely.
Breakout Confirmation:
A strong close above/below the 3rd deviation may indicate trend continuation.
⚙️ Input Settings
📍 Anchor Time: Allows you to set the exact date and time to start the AVWAP calculation.
🎯 Ideal For
✅ Intraday traders looking for short-term mean reversion plays.
✅ Swing traders identifying key support/resistance zones.
✅ Trend traders confirming long-term market direction.
✅ Volatility traders using standard deviation for trade entries.
Volume Weighted Average Price - CoinruleVWAP with additional Anchor Periods as supported on Coinrule.
Uptrick: Zero Lag HMA Trend Suite1. Name and Purpose
Uptrick: Zero Lag HMA Trend Suite is a Pine Version 6 script that builds upon the Hull Moving Average (HMA) to offer an advanced trend analysis tool. Its purpose is to help traders identify trend direction, potential reversals, and overall market momentum with reduced lag compared to traditional moving averages. By combining the HMA with Average True Range (ATR) thresholds, slope-dependent coloring, Volume Weighted Average Price (VWAP) ribbons, and optional reversal signals, the script aims to give a detailed view of price activity in various market environments.
2. Overview
This script begins with the calculation of a Hull Moving Average, a method that blends Weighted Moving Averages in a way designed to cut down on lag while still smoothing out price fluctuations. Next, several enhancements are applied. The script compares current HMA values to previous ones for slope-based coloring, which highlights uptrends and downtrends at a glance. It also plots buy and sell signals when price moves beyond or below thresholds determined by the ATR and the user’s chosen signal multiplier. An optional VWAP ribbon can be shown to confirm bullish or bearish conditions relative to a volume-weighted benchmark. Additionally, the script can plot reversal signals (labeled with B) at points where price crosses back toward the HMA from above or below. Taken together, these elements allow traders to visualize both the short-term momentum and the broader context of how price interacts with volatility and overall market direction.
3. Why These Indicators Have Been Linked Together
The reason the Hull Moving Average, the Average True Range, and the VWAP have been integrated into one script is to tackle multiple facets of market analysis in a single tool. The Zero Lag Hull Moving Average provides a responsive trend line, the ATR offers a measure of volatility that helps distinguish significant price shifts from typical fluctuations, and the VWAP acts as a reference for fair value based on traded volume. By layering all three, the script helps traders avoid the need to juggle multiple separate indicators and offers a holistic perspective. The slope-based coloring focuses on trend direction, the ATR-based thresholds refine possible buy and sell zones, and the VWAP ribbons provide insight into how price stands relative to an important volume-weighted level. The inclusion of up and down signals and reversal B labels further refines entries and exits.
4. Why Use Uptrick: Zero Lag HMA Trend Suite
The Hull Moving Average is already known for reacting more quickly to price changes compared to other moving averages while retaining a degree of smoothness. This suite enhances the basic HMA by showing colored gradients that make it easy to spot trend direction changes, highlighting potential entry or exit points based on volatility-driven thresholds, and optionally layering a volume-based measure of bullish or bearish market sentiment. By relying on a zero lag approach and additional data points, the script caters to those wanting a more responsive method of identifying shifts in market dynamics. The added reversal signals and up or down alerts give traders extra confirmation for potential turning points.
5. How This Extension Improves on the Basic HMA
This extension not only plots the Hull Moving Average but also includes data-driven alerts and visual cues that traditional HMA lines do not provide. First, it offers multi-layered slope coloring, making up or down trends quickly apparent. Second, it uses ATR-based thresholds to pinpoint moments when price may be extending beyond normal volatility, thus generating buy or sell signals. Third, the script introduces an optional VWAP ribbon to indicate whether the market is trading above or below this pivotal volume-weighted benchmark, adding a further confirmation step for bullish or bearish conditions. Finally, it incorporates optional reversal signals labeled with B, indicating points where price might swing back toward the main HMA line.
6. Core Components
The script can be broken down into several primary functions and features.
a. Zero Lag HMA Calculation
Uses two Weighted Moving Averages (half-length and full-length) combined through a smoothing step based on the square root of the chosen length. This approach is designed to reduce lag significantly compared to other moving averages.
b. Slope Detection
Compares current and prior HMA values to determine if the trend is up or down. The slope-based coloring changes between turquoise shades for upward movement and magenta shades for downward movement, making trend direction immediately visible.
c. ATR-Based Thresholding for Up and Down Signals
The script calculates an Average True Range over a user-defined period, then multiplies it by a signal factor to form two bands around the HMA. When price crosses below the lower band, an up (buy) signal appears; when it crosses above the upper band, a down (sell) signal is shown.
d. Reversal Signals (B Labels)
Tracks when price transitions back toward the main HMA from an extreme zone. When enabled, these reversal points are labeled with a B and can help traders see potential turning points or mean-reversion setups.
e. VWAP Bands
An optional Volume Weighted Average Price ribbon that plots above or below the HMA, indicating bullish or bearish conditions relative to a volume-weighted price benchmark. This can also act as a kind of support/ resistance.
7. User Inputs
a. HMA Length
Controls how quickly the moving average responds to price changes. Shorter lengths react faster but can lead to more frequent signals, whereas longer lengths produce smoother lines.
b. Source
Specifies the price input, such as close or an alternative source, for the calculation. This can help align the HMA with specific trading strategies.
c. ATR Length and Signal Multiplier
Defines how the script calculates average volatility and sets thresholds for buy or sell alerts. Adjusting these values can help filter out noise or highlight more aggressive signals.
d. Slope Index
Determines how many bars to look back for detecting slope direction, influencing how sensitive the slope coloring is to small fluctuations.
e. Show Buy and Sell Signals, Reversal Signals, and VWAP
Lets users toggle the display of these features. Turning off certain elements can reduce chart clutter if traders prefer a simpler layout.
8. Calculation Process
The script’s calculation follows a step-by-step approach. It first computes two Weighted Moving Averages of the selected price source, one over half the specified length and one over the full length. It then combines these using 2*wma1 minus wma2 to reduce lag, followed by applying another weighted average using the square root of the length. Simultaneously, it computes the ATR for a user-defined period. By multiplying ATR by the signal multiplier, it establishes upper and lower bands around the HMA, where crossovers generate buy (up) or sell (down) signals. The script can also plot reversal signals (B labels) when price crosses back from these bands in the opposite direction. For the optional VWAP feature, Pine Script’s ta.vwap function is used, and differences between the HMA and VWAP levels determine the color and opacity of the ribbon.
9. Signal Generation and Filtering
The ATR-based thresholds reduce the influence of small, inconsequential price swings. When price falls below the lower band, the script issues an up (buy) signal. If price breaks above the upper band, a down (sell) signal appears. These signals are visible through labels placed near the bars. Reversal signals, labeled with B, can be turned on to help detect when price retraces from an extended area back toward the main HMA line. Traders can disable or enable these signals to match their preferred level of chart detail or risk tolerance.
10. Visualization on the Chart
The Zero HMA Lag Trend Suite aims for visual clarity. The HMA line is plotted multiple times with increasing transparency to create a gradient effect. Turquoise gradients indicate upward slopes, and magenta gradients signify downward slopes. Bar coloring can be configured to align with the slope direction, providing quick insight into current momentum. When enabled, buy or sell labels are placed under or above the bars as price crosses the ATR-defined boundaries. If the reversal option is active, B labels appear around areas where price changes direction. The optional VWAP ribbons form background bands, using distinct coloration to signal whether price is above or below the volume-weighted metric.
11. Market Adaptability
Because the script’s parameters (HMA length, ATR length, signal multiplier, and slope index) are user-configurable, it can adapt to a wide range of markets and timeframes. Intraday traders may prefer a shorter HMA length for quick signals, while swing or position traders might use a longer HMA length to filter out short-lived price changes. The source setting can also be adjusted, allowing for specialized data inputs beyond just close or open values.
12. Risk Management Considerations
The script’s signals and labels are based on past price data and volatility readings, and they do not guarantee profitable outcomes. Sharp market reversals or unforeseen fundamental events can produce false signals. Traders should combine this tool with broader risk management strategies, including stop-loss placement, position sizing, and independent market analyses. The Zero HMA Lag Trend Suite can help highlight potential opportunities, but it should not be relied upon as the sole basis for trade decisions.
13. Combining with Other Tools
Many traders choose to verify signals from the Zero HMA Lag Trend Suite using popular indicators like the Relative Strength Index (RSI), Moving Average Convergence Divergence (MACD), or even simple volume-based metrics to confirm whether a price movement has sufficient momentum. Conventional techniques such as support and resistance levels, chart patterns, or candlestick analysis can also supplement signals generated by the script’s up, down, or reversal B labels.
14. Parameter Customization and Examples
a. Short-Term Day Trading
Using a shorter HMA length (for instance, 9 or 14) and a slightly higher ATR multiplier might provide timely buy and sell signals, though it may also produce more whipsaws in choppy markets.
b. Swing or Position Trading
Selecting a longer HMA length (such as 50 or 100) with a moderate ATR multiplier can help users track more significant and sustained market moves, potentially reducing the effect of minor fluctuations.
c. Multiple Timeframe Blends
Some traders load two versions of the indicator on the same chart, one for short-term signals (with frequent B label reversals) and another for the broader trend direction, aligning entry and exit decisions with the bigger picture.
15. Realistic Expectations
Even though the Hull Moving Average helps minimize lag and the script incorporates volatility-based filters and optional VWAP overlays, it cannot predict future market behavior with complete accuracy. Periods of low liquidity or sudden market shocks can still lead to signals that do not reflect longer-term trends. Frequent parameter review and manual confirmation are advised before executing trades based solely on the script’s outputs.
16. Theoretical Background
The Hull Moving Average formula aims to balance smoothness with reactivity, accomplished by combining Weighted Moving Averages at varying lengths. By subtracting a slower average from a faster one and then applying another smoothing step with the square root of the original length, the HMA is designed to respond more promptly to price changes than typical exponential or simple moving averages. The ATR component, introduced by J. Welles Wilder, calculates the average range of price movement over a user-defined period, allowing the script to assess volatility and adapt signals accordingly. VWAP provides a volume-weighted benchmark that many institutional traders track to gauge fair intraday value.
17. Originality and Uniqueness
Although multiple HMA-based indicators can be found, Uptrick: Zero Lag HMA Trend Suite sets itself apart by merging slope-based coloring, ATR thresholds, VWAP ribbons, up or down labels, and optional reversal signals all in one cohesive platform. This synergy aims to reduce chart clutter while still giving traders a comprehensive look at trend direction, volatility, and volume-based sentiment.
18. Summary
Uptrick: Zero Lag HMA Trend Suite is a specialized trading script designed to highlight potential market trends and reversals with minimal delay. It leverages the Hull Moving Average for an adaptive yet smooth price line, pairs ATR-based thresholds for detecting possible breakouts or dips, and provides VWAP-based ribbons for added volume-weighted context. Traders can further refine their entries and exits by enabling up or down signals and reversal labels (B) where price may revert toward the HMA. Suitable for a wide range of timeframes and instrument types, the script encourages a disciplined approach to trade management and risk control.
19. Disclaimer
This script is provided for informational and educational purposes only. Trading and investing involve significant financial risk, and no indicator can guarantee success under all conditions. Users should practice robust risk management, including the placement of stop losses and position sizing, and should confirm signals with additional analysis tools. The developer of this script assumes no liability for any trading decisions or outcomes resulting from its use.

OHLC/4 Daily vs Quarterly CrossOHLC/4 Daily vs Quarterly Cross
The "OHLC/4 Daily vs Quarterly Cross" indicator is a powerful tool designed to provide traders with insights into trend alignment and potential market turning points. By calculating the average of the open, high, low, and close prices (OHLC/4), this script compares the daily average price action with the quarterly average to identify significant crossover events.
This indicator features two distinct lines: the Daily OHLC/4 and the Quarterly OHLC/4, each plotted in different colors for easy differentiation. A crossover occurs when the daily OHLC/4 moves above the quarterly average, potentially signaling bullish momentum or a shift in market direction. Conversely, a crossunder marks the daily OHLC/4 moving below the quarterly level, indicating potential bearish sentiment or a reversal.
With real-time plotting and built-in alert conditions, this script enables traders to stay ahead of critical market movements by setting automated notifications for crossover events. Whether you're seeking to confirm trends or identify new opportunities, the "OHLC/4 Daily vs Quarterly Cross" delivers clarity and actionable insights for more informed decision-making.

Multi-Timeframe Technical IndicatorThis Multi-Timeframe Technical Indicator is designed for use in financial markets to assist traders in evaluating various key technical indicators across multiple timeframes. The indicator displays a table that includes the values of Moving Averages (MA), Relative Strength Index (RSI), Momentum, and VWAP for a range of timeframes, allowing for the evaluation of trends in real-time.
Key Features:
Multiple Timeframes: The indicator supports timeframes ranging from as low as 1 minute up to 1 month. By tracking indicators on multiple timeframes, traders can make better-informed decisions based on trends across different periods (e.g., short-term vs. long-term trends).
Technical Indicators:
Moving Average (MA): The MA provides insight into the trend direction of the asset's price. It can be configured as Simple Moving Average (SMA), Exponential Moving Average (EMA), or Weighted Moving Average (WMA).
Relative Strength Index (RSI): A momentum oscillator that measures the speed and change of price movements. RSI values below 50 suggest an upward trend, while values above 50 indicate a downward trend.
Momentum: Measures the rate of change of an asset's price, highlighting whether the price is increasing or decreasing.
VWAP (Volume Weighted Average Price): Reflects the average price of the asset weighted by its trading volume. Traders use this value to gauge the fair value of an asset.
Trend Indicators: The table dynamically displays trend arrows (↑ or ↓) based on the comparison of each indicator's value to the previous timeframe’s value. This allows users to identify the prevailing market sentiment or trend at a glance.
Visualization: The data is presented in an easy-to-read table format, where each value is accompanied by color-coded indicators (e.g., green for bullish trends, red for bearish trends). This provides a clear and visually accessible way to interpret complex market conditions.
Use Cases:
Day Trading: Helps day traders assess the momentum and strength of a price move on short-term timeframes like 1-minute, 5-minute, and 15-minute intervals.
Swing Trading: Provides insights into medium-term trends using 1-hour, 4-hour, and daily data points.
Long-Term Analysis: Useful for traders and investors looking to gauge the overall health of an asset over weeks or months, analyzing the 1-week and 1-month indicators.
Limitations and Risks:
As with all technical indicators, it is important to remember that the Multi-Timeframe Technical Indicator is not foolproof. While technical analysis offers valuable insights, it does not guarantee success and can lead to losses. Traders should always use a combination of different methods (technical and fundamental) and consult with financial advisors before making trading decisions.
The indicator operates as a tool for analysis but should not be the sole basis for trading decisions. According to Elder (1993), no indicator is perfect, and it is crucial to combine multiple factors when assessing market conditions. Additionally, Murphy (1999) emphasized the importance of understanding the limitations of indicators, as they are based on historical price movements and may not always predict future trends accurately.
References:
Elder, A. (1993). Trading for a Living. Wiley.
Murphy, J. J. (1999). Technical Analysis of the Financial Markets. New York Institute of Finance.
This Multi-Timeframe Technical Indicator is built to provide real-time, comprehensive data for informed decision-making, and is best used in conjunction with other analysis methods to manage risk effectively.

Trading TimesThis script is based on the 9 and 20 EMA Strategy and combines Fibonacci Levels for added confluence.
When the price retests after breaking the EMAs, we take the trade in the same direction. That is on breakup, we take a long and on a breakdown we take a short.
VWAP can be enabled from settings for more data. institutions use it to average out their trades for both buy and sell orders.
