$SOL/BTC Will CRYPTOCAP:SOL build strong dominance beside CRYPTOCAP:BTC ? As we know CRYPTOCAP:SOL is a top pick by many, and can eventually become something like CRYPTOCAP:ETH price wise.
SOLBTC trade ideas

4H SOLBTC [R:r 5:1] long the pullback by March 3rd or 4thSolana is going to pullback to the 4H support line before moving up. We are extremely oversold on the daily RSI and this along with the bullish news means that once the consolidation and correction after the Trump Strategic Reserve hype dissolves, we will resume our bullish SOLBTC pattern. Keep a stop below the 3D low as a break or close below this means a continuation of the weekly bearish move.

SOL vs BTC has triggered a Head and Shoulders.LA Vape Cabal
Donald Trump
Dave Portnoy
Libra
The band of thieves operating on Solana has stripped away all the opportunities for retail investors. Their relentless stealing has created a bitter experience for newcomers, while the veteran retail investors are barely hanging on.
The SOLBTC chart clearly shows the formation of a head and shoulders pattern, which has been triggered and is poised to significantly diminish satoshi value.

Wave5 in making against BTCWe been consolidating for over 9 months, wave4 retrace 0.5 (0.0018) become strong support at this point. Now can be used as soft stop at this point.
Shall we break above peak of wave3, 1.272 target around 0.0035 and 1.618 around 0.0043 will become zone of interest for wave5. We simply revisit peaks from 2021 and can form whatever double top it is.

SOL/BTC as a ProxyMore readable than the BTC.D or TOTAL3 chart (it includes stables and is lagging).
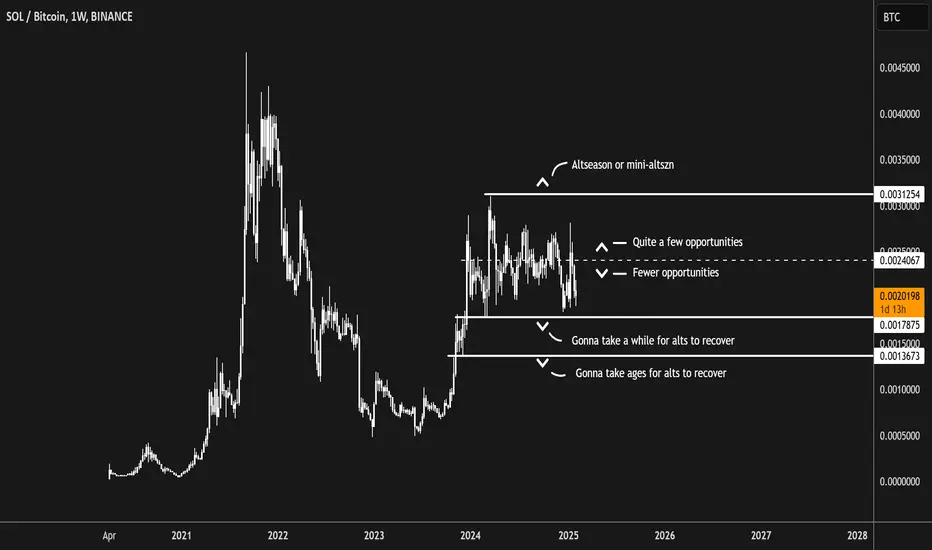

Analysis for SOL/BTC Pair:Current Market Structure:
The chart illustrates a clear range-bound structure with defined support and resistance levels.
The price has been oscillating within the horizontal range marked by:
Support: ~0.0018052 BTC
Resistance: ~0.0029090 BTC
Key Levels to Watch:
Support Zone (0.0018052 BTC):
This level has previously acted as a strong demand zone, and the price may attempt to rebound if it revisits this area.
Resistance Zone (0.0029090 BTC):
The price has failed multiple times to break above this level, as marked by points B, D, and F.
Potential Scenarios:
Bullish Case:
A successful breakout above 0.0029090 BTC could confirm a bullish wave (W3), pushing the price toward higher targets.
The next potential target beyond the range would be around 0.0045000 BTC, aligning with previous highs and psychological levels.
Bearish Case:
If the price breaks below the support zone at 0.0018052 BTC, a deeper correction could occur, leading to lower levels.
Traders should monitor for potential bearish continuation patterns below this level.
Elliott Wave Perspective:
The chart highlights the possibility of an Elliott Wave pattern forming.
The price might currently be completing wave E, preparing for a bullish wave W3 upward.
Market Sentiment:
The chart suggests indecision, with the price consolidating within the range.
A breakout on either side of the range could determine the next directional move.
Conclusion:
Bullish Breakout Confirmation: Look for a break and close above 0.0029090 BTC with high volume.
Bearish Breakdown Confirmation: Watch for sustained trading below 0.0018052 BTC.
Stay cautious of false breakouts and monitor overall market conditions for confirmation.

SOLBTC advanceuptrend signal on the monthly timeframe
not much else to say but trading view asks for more characters
cheers
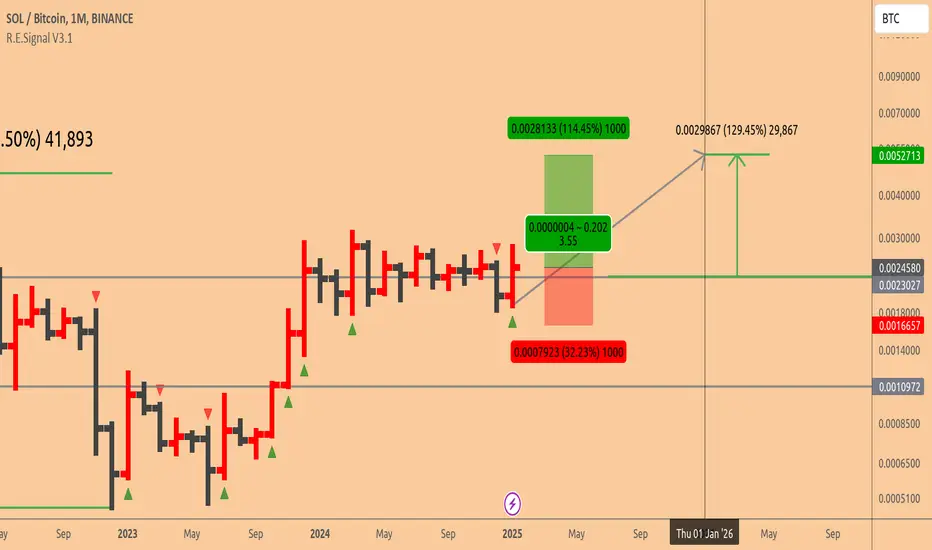
SOLBTC tradeing ideaSOLBTC continues to exhibit bullish momentum, consolidating within a pennant structure, indicative of a potential wave 4 corrective phase in the current Elliott wave cycle.
This continuation pattern provides a strategic framework for positioning, with the anticipated breakout signaling the initiation of wave 5, targeting the final impulse leg. The designated immediate demand zone serves as a critical area for potential re-entry, offering a high-probability accumulation zone should price retrace.
The projected target for the next impulse is outlined on the chart. Share your technical insights on this setup!

W pattern - SOL/BTCNice little W pattern playing out. Expect a break and then retest of the 1st resistance line. Assuming it holds on 1 hr (with only a wick below), could be a nice entry point. Anyway, TP lines set out. Fingers crossed.
www.tradingview.com

Eth/Btc and Sol/Btc similaritiesWill Sol/Btc follow a similar path to Eth/Btc - It seems like Eth needs a rival, previously thats been Neo/Eos/Ada..so that case what is the next Sol - Opinions are welcome...

Solana likely to outperform bitcoin short termSeems like it has found support at range low and can go back higher for the foreseeable future

SOL/BTC likely drags down the entire crypto market- almost a year long consolidation that has broken to the downside
- with SOL/USD losing range highs (comments) it is very likely Solana has much further to fall and could take the entire crypto market with it
- Bitcoin target sub 90k, Solana to fall below 150$

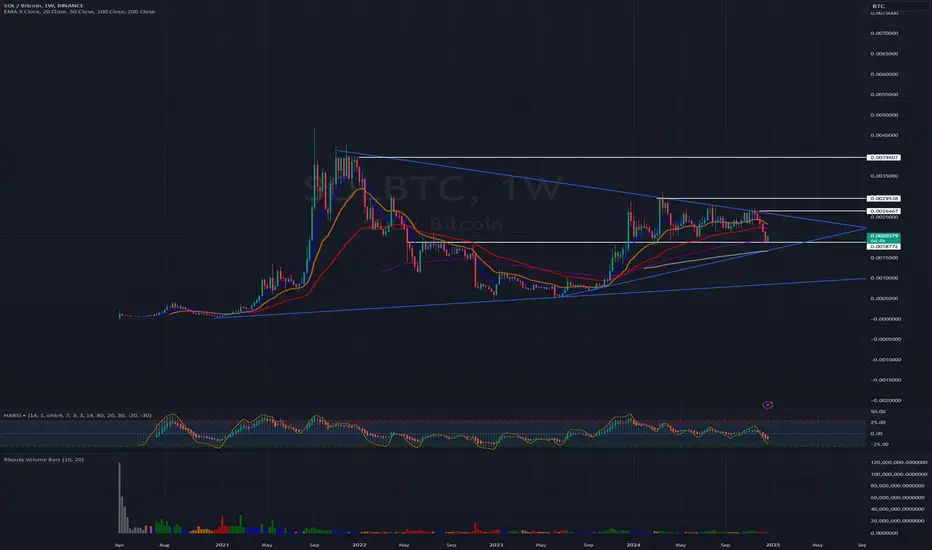
SOL/BTC: Ready to Moon or Just Another Dead Cat Bounce?Currently, Solana (SOL) is trading at 0.0020324 BTC, showing a slight dip of about 0.09% from the previous close.
The intraday high hit 0.0022316 BTC, with a low of 0.0021739 BTC.
After a prolonged downtrend since mid-2021, SOL/BTC has pulled back to a major support level at 0.0018772 BTC.
With Bitcoin experiencing a downturn and potential sideways movement, this could be an opportune moment to consider a long position on SOL.
A breakout above the downtrend line around 0.0026467 BTC could signal a rapid move toward the previous all-time high near 0.0039607 BTC.
As always, this isn't financial advice; just one ape's opinion.
Sol Extremely Bullish FractalHi
Please click like
So this is as fractal from previous bull run in 2021, and used the same fibonacci targets for this bull run.
The chart here is SOLBTC, so if peak on this chart is 0.01BTC and BTC today is 100K =
SOL 1k.
If BTC peak is 200K -> Sol is 2K... etc.
----
This is a dreamy target, but it is in my opinion important to have some extreme targets.
I have been in crypto for 7 years, and havent we all seen extreme things happen ?
Perhaps this could be possible with SOL "eth killing" and taking the coin nr 2 place ?
Watch below some other SOL vs ETH ideas. It looks.. possible..
Or ? What do you think ?

#SOL vs. #BTCSolana is just about to complete larger wave correction pattern where price shoulder find support and trigger a massive rally.

SOL/BTCThe SOL/BTC pair has been in. a range for a very long time after its run up. I was lucky enough to get in under $50. Dont count out SOL. SOL has alot going for it, could possibly be the next ETF. Has great DEPIN and DEFI going for it. HNT is a pretty cool project I think. It has DAPPs and SOL has even dropped a phone. Dont sleep on SOL.

SOLBTC—UpdateA 300 days long support and accumulation zone has been activated. The range between 0.001700 and 0.002000. The recent drop is a bullish development.
SOLBTC can be bought at this level in anticipation of a new bullish wave.
300 days is a long time for a Cryptocurrency trading pair.
There is always a drop before a reversal.
After three hundred days of sideways we have a strong drop that is activating a major support range and at the same time producing a long-term higher low (vs March 2024). This is a bullish development and can signal the start of a new bullish wave for this pair.
Thank you for reading.
Choose to follow.
Namaste.

SOL Shows False BreakoutSolana has shown a false breakout and returned inside the triangle pattern. If the chart successfully breaks out again, it may be worth entering. A significant amount of energy has been condensed.

SOL/BTCDidnt think we were going to see this breakdown happen. Was hoping to find support at this level but it appears we have broken down. Not sure if this is an outliar and we break back above or we just range. Going to be wathing this pair very closely.

Solana (SOLBTC) Consolidation Pattern, Tough SpotI need your help. This is an interesting chart... What do we have here?
Good evening my friend, how are you doing?
Thank you for coming back, thank you for taking the time to read.
I am looking at this chart and there are so many factors to consider. The signals are mixed.
Four consecutive weeks red. SOLBTC.
Do we take this as a negative or positive?
Not once since March 2023 we have more than four weeks closing red. This can mean that this pair is soon to turn green.
Once in 2023 and then again in 2022 in the bear market. These are the only instances in which SOLBTC closed more than four weeks read. In all of 2024, the maximum is four weeks.
The action is happening right above EMA55. We have a super long-term consolidation pattern. The entire market is advancing. It would be safe to assume that this pair will also advance, but the signals are mixed.
It looks like mid 2021. Back then, the consolidation pattern was small in duration, this time, it is long; alternation.
I made up my mind. I think it is going to go bullish even if it take a few weeks or days. There is room for some swings but this wouldn't change the long-term. Long-term it is going up. We can consider a new bullish impulse, 1-2-3-4-5 or the extension of a previous one.
The bullish action ended in December 2023 which is almost a year ago, so far we have seen consolidation only, sideways, the longer the consolidation phase the stronger the move that follows.
The initial move is a bullish wave coming out of the 2022 bear-market bottom and 2023 higher lows. The consolidation is for this move. A bullish move has been consolidated long-term before additional growth.
Bottom line is I am going bullish on this pair so I am making all these things up. Hopefully, my thinking is supported by the chart.
I am writing for your entertainment.
It is my pleasure to write for you today.
Namaste.

Parabolic Patterns: ETH/BTC and SOL/ETH Trends into 2026The parabolic move for ETH/BTC could extend well into 2026. The SOL/ETH chart appears to be losing steam, much like the ETH/BTC chart did. The similarities are striking. Does this mean SOL will start losing steam from here?

