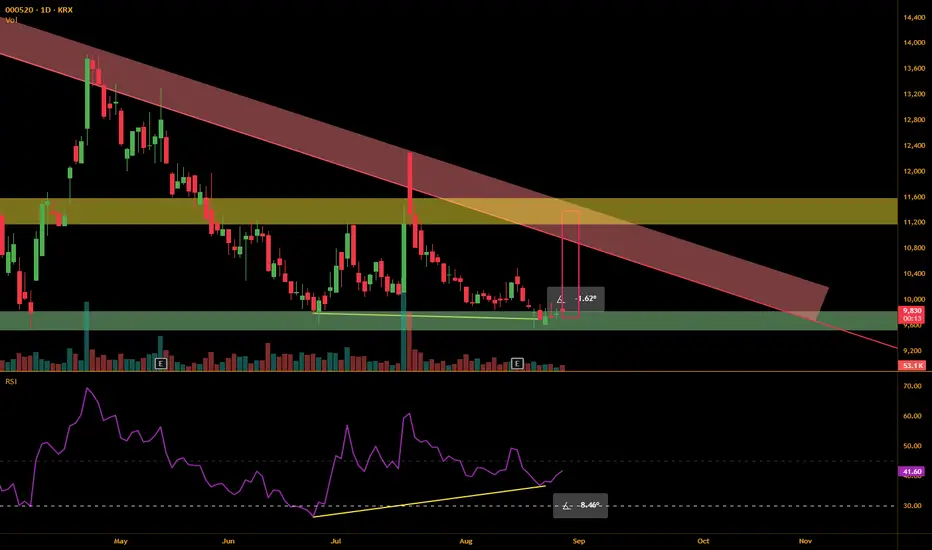
We see two overlapping bullish signals for $KRX:000520.
First signal is RSI Divergence, price making lower lows while RSI makes higher lows.
While the price difference isn't great, RSI difference is bigger, with the latest low pivot being 10 points higher than the previous one.
Second signal is price moving within the flat bottom wedge.
The price has historically rebounded whenever it entered the support zone of 9500 - 9800.
This is the third time price entering the zone, which isn't most ideal,
but the RSI Divergence reinforces the probability of a bullish trend.
If we see a bullish candle tomorrow with RSI surpassing 45 line, then might be a good time to enter long.
It is best to enter below 10,400, ideally around 10,200.
The first sell point would be slightly below the red resistance line, between 10,600 and 10,900.
The second and final sell point would be the yellow price action zone.
Estimated profit is 4%+ in 4-5 weeks.
ملاحظة
We see a bullish candle today.
God bless you :)
إخلاء المسؤولية
لا يُقصد بالمعلومات والمنشورات أن تكون، أو تشكل، أي نصيحة مالية أو استثمارية أو تجارية أو أنواع أخرى من النصائح أو التوصيات المقدمة أو المعتمدة من TradingView. اقرأ المزيد في شروط الاستخدام.
God bless you :)
إخلاء المسؤولية
لا يُقصد بالمعلومات والمنشورات أن تكون، أو تشكل، أي نصيحة مالية أو استثمارية أو تجارية أو أنواع أخرى من النصائح أو التوصيات المقدمة أو المعتمدة من TradingView. اقرأ المزيد في شروط الاستخدام.