1. Introduction
The 10-Year Yield Futures market has recently drawn attention as it builds a constructive base and attempts to shift momentum higher. After weeks of choppy movement, price action on the 4-hour chart has resolved into a breakout scenario that could define the next leg for yields. At the heart of this case study is a double bottom formation, a classical reversal structure, confirmed at 4.321. What makes this setup more compelling is the presence of nearby support and resistance zones, providing a precise technical framework to define entries, targets, and stop placement with discipline.
2. Double Bottom Pattern
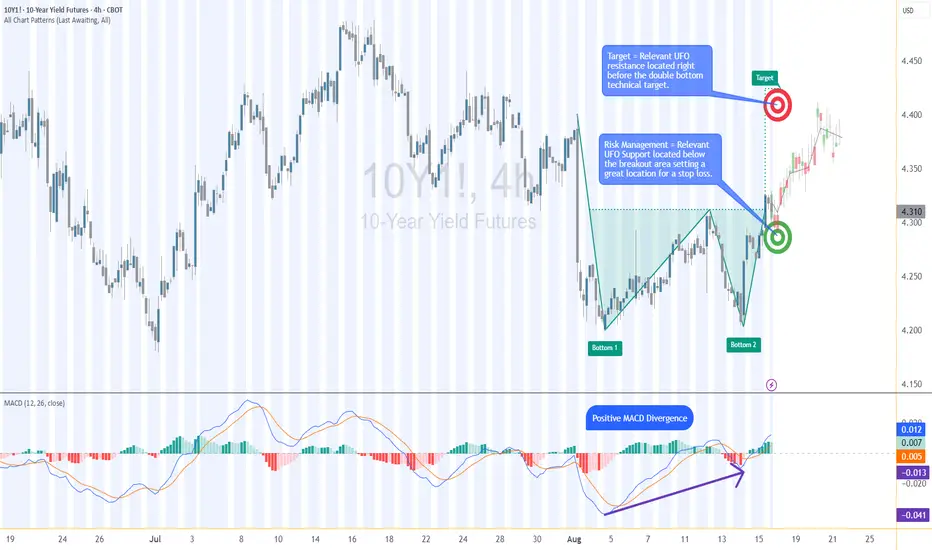
The double bottom is one of the most reliable chart patterns signaling the potential exhaustion of selling pressure. It typically forms after a downtrend, with two consecutive troughs creating a strong support base before buyers regain control. In the current 10-Year Yield Futures chart, the first bottom occurred near 4.20, followed by a retest close to the same level. The neckline breakout emerged at 4.312, marking the confirmation point. Applying classical pattern analysis, the measured move points toward a target near 4.396. This alignment of structure and projection provides traders with a clear and objective technical roadmap.
3. MACD Confirmation
Momentum indicators often add depth to price action analysis, and the MACD (Moving Average Convergence Divergence) is one of the most widely followed. Built from the relationship of short- and long-term moving averages, it helps reveal underlying shifts in strength. In the current 10-Year Yield Futures chart, the MACD displayed a positive divergence: while price carved lower lows during the second bottom, the MACD lines began to slope higher. This divergence often signals weakening bearish momentum and the early stages of accumulation. In this case, it reinforces the validity of the double bottom breakout and its bullish potential.
4. UFO Support & Resistance
UnFilled Orders, or UFOs, represent areas where pending buy or sell orders may remain active, providing powerful zones of support or resistance. On the 10-Year Yield Futures chart, a key UFO support sits just below the breakout at 4.278, making it a logical stop-loss placement to protect the trade. Meanwhile, the upside target of the double bottom at 4.396 coincides with a UFO resistance zone. This overlap creates a clear exit area where supply may re-emerge. By combining classical charting techniques with order-flow–based zones, traders gain a structured plan that balances opportunity with risk control.
5. Trade Idea (Illustrative Case Study)
In this case study, the trade idea develops around the breakout point of 4.312 with the current price at the time of writing this article of 4.321. A trader could consider going long if the market sustains above this neckline level. The projected target is the resistance zone at 4.396, while the protective stop loss can be placed just below the UFO support at 4.278. This creates a defined risk profile with a reward-to-risk ratio of roughly 2:1. Alternatively, more conservative traders might consider a wider stop beneath the second bottom, offering more tolerance against volatility but at the expense of risk-reward efficiency. Both options maintain risk clarity and structure.
6. Contract Specifications & Margin Overview
The 10-Year Yield Futures (ticker: 10Y or 10Y1! on TradingView) is a cash-settled futures contract that tracks the 10-year U.S. Treasury yield directly. The gain or loss per tick per contract is as follows: 1 tick = 0.001 Index points (1/10th basis point per annum) = $1.00.
According to CME’s margin schedule (which changes as market conditions change through time), the current margin requirement is approximately $300 per contract. These relatively modest requirements make the product accessible while still providing meaningful exposure to U.S. interest rate markets.
7. Importance of Risk Management
Even with technically strong setups, the defining factor between consistent traders and inconsistent ones is risk management. Futures are leveraged products, meaning a small price move can translate into significant profit or loss. Using stop-loss orders helps enforce discipline, ensuring that one trade does not spiral into uncontrolled exposure. In this case, the support at 4.278 provides a logical technical area for a stop. Regardless of market outlook, avoiding undefined risk is key to long-term survival and consistency.
8. Closing Remarks
The alignment of a double bottom breakout, positive MACD divergence, and key support and resistance zones creates a textbook technical case study in the 10-Year Yield Futures market. With a clearly defined entry, target, and stop-loss, this setup demonstrates how combining price patterns with momentum and order-flow levels can help build structured trade plans. Yet, no analysis guarantees outcomes, and discipline remains at the core of every approach.
When charting futures, the data provided could be delayed. Traders working with the ticker symbols discussed in this idea may prefer to use CME Group real-time data plan on TradingView: tradingview.com/cme/ - This consideration is particularly important for shorter-term traders, whereas it may be less critical for those focused on longer-term trading strategies.
General Disclaimer:
The trade ideas presented herein are solely for illustrative purposes forming a part of a case study intended to demonstrate key principles in risk management within the context of the specific market scenarios discussed. These ideas are not to be interpreted as investment recommendations or financial advice. They do not endorse or promote any specific trading strategies, financial products, or services. The information provided is based on data believed to be reliable; however, its accuracy or completeness cannot be guaranteed. Trading in financial markets involves risks, including the potential loss of principal. Each individual should conduct their own research and consult with professional financial advisors before making any investment decisions. The author or publisher of this content bears no responsibility for any actions taken based on the information provided or for any resultant financial or other losses.
The 10-Year Yield Futures market has recently drawn attention as it builds a constructive base and attempts to shift momentum higher. After weeks of choppy movement, price action on the 4-hour chart has resolved into a breakout scenario that could define the next leg for yields. At the heart of this case study is a double bottom formation, a classical reversal structure, confirmed at 4.321. What makes this setup more compelling is the presence of nearby support and resistance zones, providing a precise technical framework to define entries, targets, and stop placement with discipline.
2. Double Bottom Pattern
The double bottom is one of the most reliable chart patterns signaling the potential exhaustion of selling pressure. It typically forms after a downtrend, with two consecutive troughs creating a strong support base before buyers regain control. In the current 10-Year Yield Futures chart, the first bottom occurred near 4.20, followed by a retest close to the same level. The neckline breakout emerged at 4.312, marking the confirmation point. Applying classical pattern analysis, the measured move points toward a target near 4.396. This alignment of structure and projection provides traders with a clear and objective technical roadmap.
3. MACD Confirmation
Momentum indicators often add depth to price action analysis, and the MACD (Moving Average Convergence Divergence) is one of the most widely followed. Built from the relationship of short- and long-term moving averages, it helps reveal underlying shifts in strength. In the current 10-Year Yield Futures chart, the MACD displayed a positive divergence: while price carved lower lows during the second bottom, the MACD lines began to slope higher. This divergence often signals weakening bearish momentum and the early stages of accumulation. In this case, it reinforces the validity of the double bottom breakout and its bullish potential.
4. UFO Support & Resistance
UnFilled Orders, or UFOs, represent areas where pending buy or sell orders may remain active, providing powerful zones of support or resistance. On the 10-Year Yield Futures chart, a key UFO support sits just below the breakout at 4.278, making it a logical stop-loss placement to protect the trade. Meanwhile, the upside target of the double bottom at 4.396 coincides with a UFO resistance zone. This overlap creates a clear exit area where supply may re-emerge. By combining classical charting techniques with order-flow–based zones, traders gain a structured plan that balances opportunity with risk control.
5. Trade Idea (Illustrative Case Study)
In this case study, the trade idea develops around the breakout point of 4.312 with the current price at the time of writing this article of 4.321. A trader could consider going long if the market sustains above this neckline level. The projected target is the resistance zone at 4.396, while the protective stop loss can be placed just below the UFO support at 4.278. This creates a defined risk profile with a reward-to-risk ratio of roughly 2:1. Alternatively, more conservative traders might consider a wider stop beneath the second bottom, offering more tolerance against volatility but at the expense of risk-reward efficiency. Both options maintain risk clarity and structure.
6. Contract Specifications & Margin Overview
The 10-Year Yield Futures (ticker: 10Y or 10Y1! on TradingView) is a cash-settled futures contract that tracks the 10-year U.S. Treasury yield directly. The gain or loss per tick per contract is as follows: 1 tick = 0.001 Index points (1/10th basis point per annum) = $1.00.
According to CME’s margin schedule (which changes as market conditions change through time), the current margin requirement is approximately $300 per contract. These relatively modest requirements make the product accessible while still providing meaningful exposure to U.S. interest rate markets.
7. Importance of Risk Management
Even with technically strong setups, the defining factor between consistent traders and inconsistent ones is risk management. Futures are leveraged products, meaning a small price move can translate into significant profit or loss. Using stop-loss orders helps enforce discipline, ensuring that one trade does not spiral into uncontrolled exposure. In this case, the support at 4.278 provides a logical technical area for a stop. Regardless of market outlook, avoiding undefined risk is key to long-term survival and consistency.
8. Closing Remarks
The alignment of a double bottom breakout, positive MACD divergence, and key support and resistance zones creates a textbook technical case study in the 10-Year Yield Futures market. With a clearly defined entry, target, and stop-loss, this setup demonstrates how combining price patterns with momentum and order-flow levels can help build structured trade plans. Yet, no analysis guarantees outcomes, and discipline remains at the core of every approach.
When charting futures, the data provided could be delayed. Traders working with the ticker symbols discussed in this idea may prefer to use CME Group real-time data plan on TradingView: tradingview.com/cme/ - This consideration is particularly important for shorter-term traders, whereas it may be less critical for those focused on longer-term trading strategies.
General Disclaimer:
The trade ideas presented herein are solely for illustrative purposes forming a part of a case study intended to demonstrate key principles in risk management within the context of the specific market scenarios discussed. These ideas are not to be interpreted as investment recommendations or financial advice. They do not endorse or promote any specific trading strategies, financial products, or services. The information provided is based on data believed to be reliable; however, its accuracy or completeness cannot be guaranteed. Trading in financial markets involves risks, including the potential loss of principal. Each individual should conduct their own research and consult with professional financial advisors before making any investment decisions. The author or publisher of this content bears no responsibility for any actions taken based on the information provided or for any resultant financial or other losses.
🌟 Take This Analysis Further with Our AI Scripts 🎯 | Discover How at tradewithufos.com 🚀 Choose a Subscription: Monthly ᴼᴿ Yearly ᴼᴿ Lifetime 🗓️ | Unlock Intelligent UFO Scripts Free 💡
منشورات ذات صلة
إخلاء المسؤولية
لا يُقصد بالمعلومات والمنشورات أن تكون، أو تشكل، أي نصيحة مالية أو استثمارية أو تجارية أو أنواع أخرى من النصائح أو التوصيات المقدمة أو المعتمدة من TradingView. اقرأ المزيد في شروط الاستخدام.