📅 Chart Type: Daily
📉 Structure Observed: Downtrend Channel → Breakout Attempt → Symmetrical Triangle
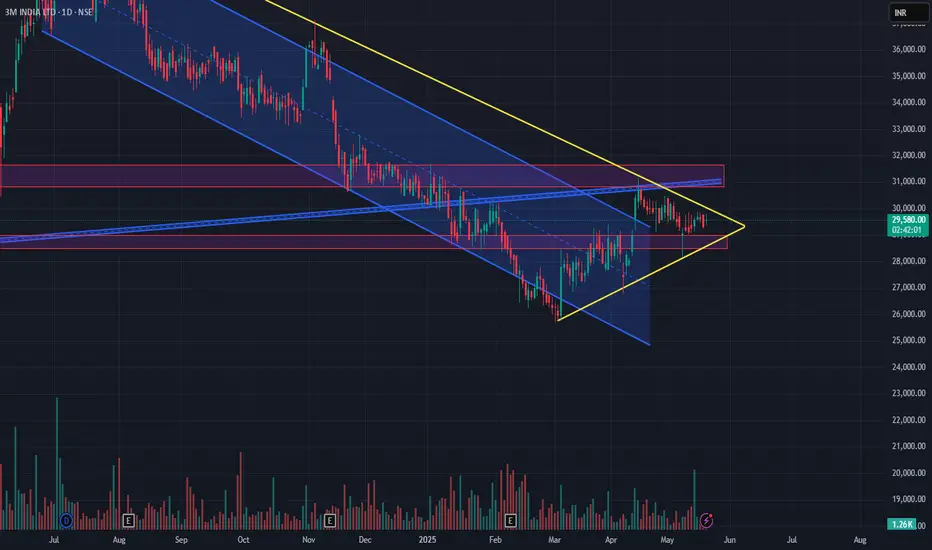
📌 Current Price: ₹29,620
🔍 Chart Analysis Summary:
3M India has been under a prolonged downtrend since mid-2023, clearly respecting the falling channel (highlighted in blue). However, since March 2025, a base seems to be forming, and price action has converged into a symmetrical triangle pattern (yellow lines), signaling a potential breakout.
💥 Trade Ideas
✅ Long Trade (High Risk, High Reward):
If price decisively breaks out above the triangle resistance (~₹30,000+), it could be the first real sign of trend reversal after months of weakness. Potential targets could be:
Stop-loss: Below ₹28,800 (lower triangle boundary)
Risk: Moderate-High (False breakout possibility due to low volume)
⚠️ Risky Trade:
Given the triangle formation at the end of a downtrend, this could also be a bearish continuation pattern. A fake breakout followed by rejection could trap bulls.
💡 Avoid trading until confirmation (volume spike + close above resistance or breakdown)
📉 Short Trade:
If price breaks below ₹28,800 with volume, the stock could revisit:
Stop-loss: ₹30,100 (triangle resistance)
Risk: Medium
Reward: High if channel resumes downward
🔁 Swing Trade Perspective:
This setup is ideal for swing traders who thrive on breakouts or breakdowns from tight consolidations.
📈 Breakout Swing: Enter above ₹30,000 with target ₹33,500
📉 Breakdown Swing: Enter below ₹28,800 with target ₹25,000
🧠 Wait for confirmation candle (daily close + volume) before entry.
📌 Key Zones to Watch:
🧠 Final Thoughts:
This is a make-or-break level for 3M India. Traders should be cautious but alert. Whether you're bullish or bearish, this consolidation is unlikely to last much longer — and a sharp move is imminent.
"In the market, the biggest profits often come from waiting for the right setup. This might be one."
📉💰 Trade responsibly. Always manage your risk.
📉 Structure Observed: Downtrend Channel → Breakout Attempt → Symmetrical Triangle
📌 Current Price: ₹29,620
🔍 Chart Analysis Summary:
3M India has been under a prolonged downtrend since mid-2023, clearly respecting the falling channel (highlighted in blue). However, since March 2025, a base seems to be forming, and price action has converged into a symmetrical triangle pattern (yellow lines), signaling a potential breakout.
💥 Trade Ideas
✅ Long Trade (High Risk, High Reward):
If price decisively breaks out above the triangle resistance (~₹30,000+), it could be the first real sign of trend reversal after months of weakness. Potential targets could be:
- ₹31,200 (resistance zone)
- ₹33,500+ (previous swing highs)
Stop-loss: Below ₹28,800 (lower triangle boundary)
Risk: Moderate-High (False breakout possibility due to low volume)
⚠️ Risky Trade:
Given the triangle formation at the end of a downtrend, this could also be a bearish continuation pattern. A fake breakout followed by rejection could trap bulls.
💡 Avoid trading until confirmation (volume spike + close above resistance or breakdown)
📉 Short Trade:
If price breaks below ₹28,800 with volume, the stock could revisit:
- ₹27,000 (March support)
- ₹25,000 (channel support retest)
Stop-loss: ₹30,100 (triangle resistance)
Risk: Medium
Reward: High if channel resumes downward
🔁 Swing Trade Perspective:
This setup is ideal for swing traders who thrive on breakouts or breakdowns from tight consolidations.
📈 Breakout Swing: Enter above ₹30,000 with target ₹33,500
📉 Breakdown Swing: Enter below ₹28,800 with target ₹25,000
🧠 Wait for confirmation candle (daily close + volume) before entry.
📌 Key Zones to Watch:
- Resistance: ₹30,000 – ₹31,200
- Support: ₹28,800, ₹27,000
- Volume Spike: Needed to confirm move direction
🧠 Final Thoughts:
This is a make-or-break level for 3M India. Traders should be cautious but alert. Whether you're bullish or bearish, this consolidation is unlikely to last much longer — and a sharp move is imminent.
"In the market, the biggest profits often come from waiting for the right setup. This might be one."
📉💰 Trade responsibly. Always manage your risk.
إخلاء المسؤولية
لا يُقصد بالمعلومات والمنشورات أن تكون، أو تشكل، أي نصيحة مالية أو استثمارية أو تجارية أو أنواع أخرى من النصائح أو التوصيات المقدمة أو المعتمدة من TradingView. اقرأ المزيد في شروط الاستخدام.
إخلاء المسؤولية
لا يُقصد بالمعلومات والمنشورات أن تكون، أو تشكل، أي نصيحة مالية أو استثمارية أو تجارية أو أنواع أخرى من النصائح أو التوصيات المقدمة أو المعتمدة من TradingView. اقرأ المزيد في شروط الاستخدام.