AAPL is roughly 4.2% of SPY.
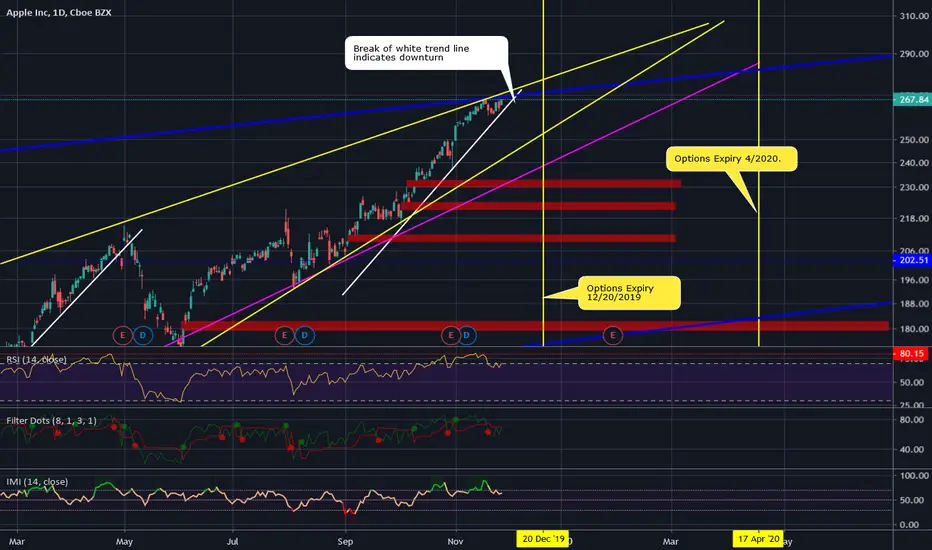
The AAPL chart and SPY chart show many similarities.
Both have a main wedge (blue) with a smaller internal wedge (yellow).
Price action, RSI, and momentum on AAPL and SPY are almost identical.
Break of white trendline would be a good entry, although I have seen several false breakdowns recently.
I am expecting a break of the yellow wedge, filling the top 3 gaps (red boxes).
For these reasons, I feel that once AAPL breaks trend in the upcoming week we will also see SPY go into correction.
My position:
I am currently in the AAPL 12/20 Puts. I have incurred a small loss waiting for the position to change momentum, which is expected.
Small position size and buying Puts at least 30+ days out is key when entering before trend occurs, at the swing point.
December 5th at latest, or 50% ($240 loss) will be exit point. Profit potential on this $480 Put was between $700-$2600 (SPY 300-270)
However with current pattern, price, and momentum being exhausted, I will keep the current Put and buy another Put farther out.
With trend at current point, any losses will be reduced as I get closer to expiry.
Puts I am considering farther out - February 2020 and April 2020.
Thank you for liking, commenting, throwing up a chart, following, or viewing.
I am not a financial advisor. My comments and reviews are based on what I do with my personal accounts.
Disclosure - I am long MARA, GBTC, BTCUSD, GDX, VIXY.
Short SPY and AAPL.
إخلاء المسؤولية
The information and publications are not meant to be, and do not constitute, financial, investment, trading, or other types of advice or recommendations supplied or endorsed by TradingView. Read more in the Terms of Use.
إخلاء المسؤولية
The information and publications are not meant to be, and do not constitute, financial, investment, trading, or other types of advice or recommendations supplied or endorsed by TradingView. Read more in the Terms of Use.