AAPL Weekly Outlook (Oct 28–31): “Apple’s Momentum Reboot — Eyes on $275 Breakout Zone!” 📱
1. Weekly (1W) Structure – Macro Breakout Confirmation
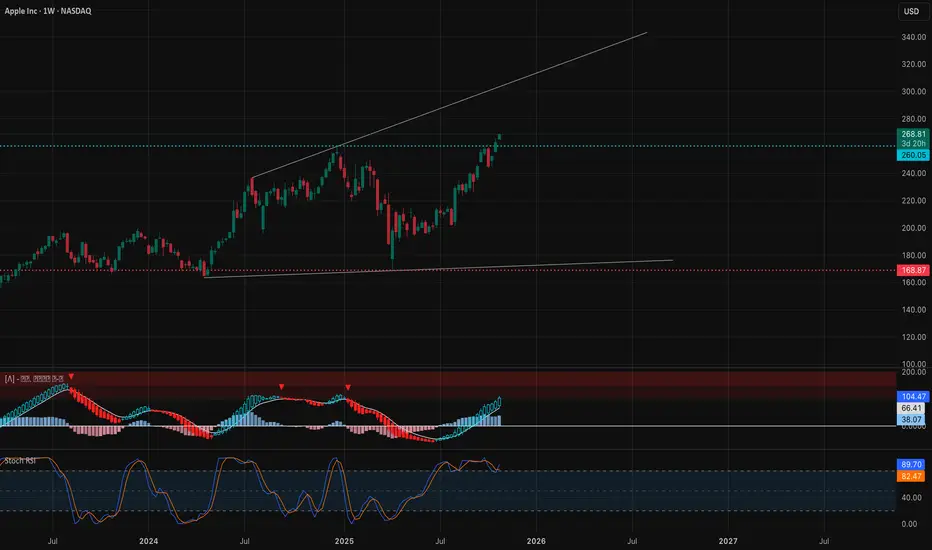
Apple has officially shifted from recovery to expansion phase. The weekly chart shows a confirmed Change of Character (CHoCH) into Break of Structure (BOS) above $260, reclaiming a bullish trajectory. Price is pushing toward the upper channel trendline near $275–$280, showing clean continuation momentum with no immediate resistance until that level.
* Bias: Bullish continuation
* Support: $224 → $260
* Resistance: $275 → $280
* MACD: Strong bullish expansion; histogram widening upward.
* Stochastic RSI: Overbought but still trending — strength, not exhaustion yet.
💡 Weekly Thought: Momentum is accelerating across the board, confirming institutional participation. Unless $260 breaks down, Apple remains a buy-on-dip candidate heading into November earnings.
2. Daily (1D) – Trend Acceleration

Daily structure is showing clean BOS sequences along an ascending parallel channel. After retesting the midline near $244–$250, Apple bounced strongly and reclaimed the $260 handle. This confirms buyers defending the demand base, now pushing price to challenge $268–$270 short-term resistance.
* Bias: Bullish continuation
* Support: $244 → $259
* Resistance: $270 → $275
* Indicators:
* MACD turning positive again after pullback reset.
* Stochastic RSI curled upward from midzone — signals renewed strength.
💭 Daily Suggestion: Look for intraday retests around $262–$264 as a potential long entry. A clean daily close above $270 opens path to $275 and eventually $280 if macro remains supportive.
3. 1-Hour (1H) – Intraday Playbook

Intraday structure aligns perfectly with higher timeframes — multiple BOS and short consolidation ranges above $260 confirm sustained bullish control. Momentum is strong, but short-term traders should be cautious of profit-taking near $270–$272 zone before the next leg higher.
* Scalp Bias: Bullish above $262
* Support: $260 → $255
* Resistance: $270 → $275
* Setup Idea:
* Call scalp: Above $266 with target $272–$275.
* Put scalp: Only below $260 breakdown, targeting $255.
📈 1H Thought: If AAPL consolidates tightly between $266–$269 early in the week, it may coil for a breakout toward $275 later this week.
4. GEX & Options Sentiment – Institutional Positioning

Gamma Exposure (GEX) data shows heavy call concentration aligning perfectly with price structure, reinforcing bullish continuation bias.
* Highest positive GEX / resistance: $269 → $275 → $280
* Support (put-dominated zones): $257 → $252
* Call ratio: 9.1% (moderate bullish exposure)
* IVR: 19.9 (low IV environment)
* IVx avg: 32.6 (slightly cooling)
Institutions are pinning price near $265–$270 with positive gamma bias. The $275–$280 zone acts as the next magnet if upward momentum persists.
5. Suggested Option Plays
* Bullish Setup (Preferred):
* Buy-to-open 270C–275C (1DTE/2DTE) if price reclaims $268 with strength.
* Target: $275–$280
* Stop: Below $260
* Reason: Gamma buildup supports continuation, clean technical breakout setup.
* Bearish Hedge (Cautious):
* Buy 255P (1DTE/2DTE) only if price breaks $260 with confirmed volume.
* Target: $252
* Stop: Above $266
Apple’s structure is aligned bullishly across all timeframes — a clear continuation from the mid-October breakout with strong call-side gamma buildup. The next move hinges on whether $270 flips to support; if so, the stock is primed for a potential $275–$280 test.
🎯 Primary Bias: Bullish toward $275–$280 ⚠️ Watch For: Breakdown under $260 = short-term exhaustion signal.
This analysis is for educational purposes only and does not constitute financial advice. Always do your own research and manage your risk before trading.
1. Weekly (1W) Structure – Macro Breakout Confirmation
Apple has officially shifted from recovery to expansion phase. The weekly chart shows a confirmed Change of Character (CHoCH) into Break of Structure (BOS) above $260, reclaiming a bullish trajectory. Price is pushing toward the upper channel trendline near $275–$280, showing clean continuation momentum with no immediate resistance until that level.
* Bias: Bullish continuation
* Support: $224 → $260
* Resistance: $275 → $280
* MACD: Strong bullish expansion; histogram widening upward.
* Stochastic RSI: Overbought but still trending — strength, not exhaustion yet.
💡 Weekly Thought: Momentum is accelerating across the board, confirming institutional participation. Unless $260 breaks down, Apple remains a buy-on-dip candidate heading into November earnings.
2. Daily (1D) – Trend Acceleration
Daily structure is showing clean BOS sequences along an ascending parallel channel. After retesting the midline near $244–$250, Apple bounced strongly and reclaimed the $260 handle. This confirms buyers defending the demand base, now pushing price to challenge $268–$270 short-term resistance.
* Bias: Bullish continuation
* Support: $244 → $259
* Resistance: $270 → $275
* Indicators:
* MACD turning positive again after pullback reset.
* Stochastic RSI curled upward from midzone — signals renewed strength.
💭 Daily Suggestion: Look for intraday retests around $262–$264 as a potential long entry. A clean daily close above $270 opens path to $275 and eventually $280 if macro remains supportive.
3. 1-Hour (1H) – Intraday Playbook
Intraday structure aligns perfectly with higher timeframes — multiple BOS and short consolidation ranges above $260 confirm sustained bullish control. Momentum is strong, but short-term traders should be cautious of profit-taking near $270–$272 zone before the next leg higher.
* Scalp Bias: Bullish above $262
* Support: $260 → $255
* Resistance: $270 → $275
* Setup Idea:
* Call scalp: Above $266 with target $272–$275.
* Put scalp: Only below $260 breakdown, targeting $255.
📈 1H Thought: If AAPL consolidates tightly between $266–$269 early in the week, it may coil for a breakout toward $275 later this week.
4. GEX & Options Sentiment – Institutional Positioning
Gamma Exposure (GEX) data shows heavy call concentration aligning perfectly with price structure, reinforcing bullish continuation bias.
* Highest positive GEX / resistance: $269 → $275 → $280
* Support (put-dominated zones): $257 → $252
* Call ratio: 9.1% (moderate bullish exposure)
* IVR: 19.9 (low IV environment)
* IVx avg: 32.6 (slightly cooling)
Institutions are pinning price near $265–$270 with positive gamma bias. The $275–$280 zone acts as the next magnet if upward momentum persists.
5. Suggested Option Plays
* Bullish Setup (Preferred):
* Buy-to-open 270C–275C (1DTE/2DTE) if price reclaims $268 with strength.
* Target: $275–$280
* Stop: Below $260
* Reason: Gamma buildup supports continuation, clean technical breakout setup.
* Bearish Hedge (Cautious):
* Buy 255P (1DTE/2DTE) only if price breaks $260 with confirmed volume.
* Target: $252
* Stop: Above $266
Apple’s structure is aligned bullishly across all timeframes — a clear continuation from the mid-October breakout with strong call-side gamma buildup. The next move hinges on whether $270 flips to support; if so, the stock is primed for a potential $275–$280 test.
🎯 Primary Bias: Bullish toward $275–$280 ⚠️ Watch For: Breakdown under $260 = short-term exhaustion signal.
This analysis is for educational purposes only and does not constitute financial advice. Always do your own research and manage your risk before trading.
إخلاء المسؤولية
لا يُقصد بالمعلومات والمنشورات أن تكون، أو تشكل، أي نصيحة مالية أو استثمارية أو تجارية أو أنواع أخرى من النصائح أو التوصيات المقدمة أو المعتمدة من TradingView. اقرأ المزيد في شروط الاستخدام.
إخلاء المسؤولية
لا يُقصد بالمعلومات والمنشورات أن تكون، أو تشكل، أي نصيحة مالية أو استثمارية أو تجارية أو أنواع أخرى من النصائح أو التوصيات المقدمة أو المعتمدة من TradingView. اقرأ المزيد في شروط الاستخدام.