Hello all, Happy Monday and it's a good day to start the week. Last week, the price has touched the $11000 zone before it's getting rejected to the $10800 ish region. The weekly candle has closed with a huge green candle after last week's doji candle which gives us a good indication. So, how will it be on the short term?
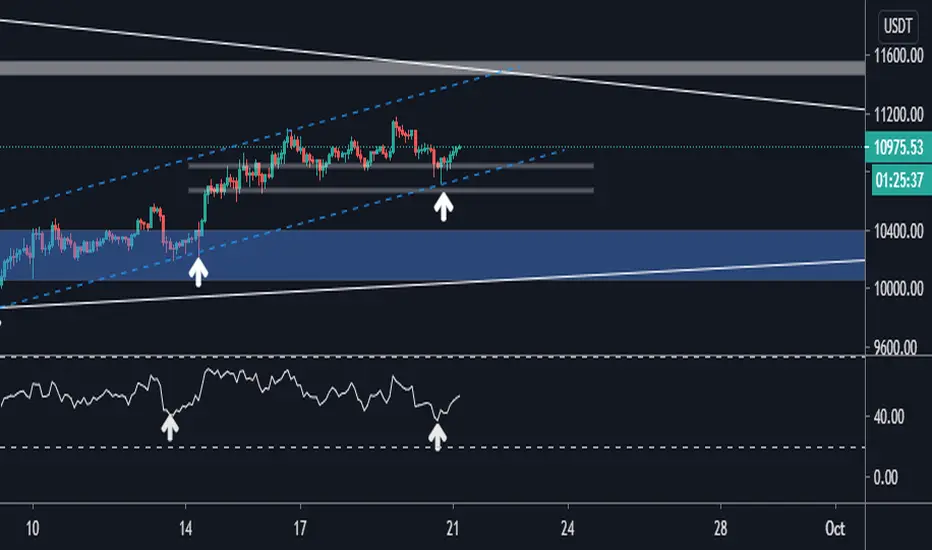
On the short term, the price is coming closer to the minor support zone at the $10800 ish. We have seen some sign of bounce from this zone with a type of long wick candle as the rejection sign toward lower region as well. If you take a closer look at this area, there are a possible sign of parallel channel to form during this pattern.
Another significant thing that we need to see the RSI indicator here where it prints another potential hidden bullish divergence on this 2 hours time frame which indicates a potential upside continuation. I feel like the price can go higher to test the $11500 region on short term to complete the X wave before we see further drop that we anticipated before as the Y wave.
منشورات ذات صلة
إخلاء المسؤولية
لا يُقصد بالمعلومات والمنشورات أن تكون، أو تشكل، أي نصيحة مالية أو استثمارية أو تجارية أو أنواع أخرى من النصائح أو التوصيات المقدمة أو المعتمدة من TradingView. اقرأ المزيد في شروط الاستخدام.
إخلاء المسؤولية
لا يُقصد بالمعلومات والمنشورات أن تكون، أو تشكل، أي نصيحة مالية أو استثمارية أو تجارية أو أنواع أخرى من النصائح أو التوصيات المقدمة أو المعتمدة من TradingView. اقرأ المزيد في شروط الاستخدام.