Adobe  ADBE was once known as one the "Cloud Kings," but the 2020s haven't been kind the stock, which has fallen nearly 50% from its November 2021 peak. Let's see what ADBE's technical and fundamental analysis shows us heading into this week's earnings report.
Adobe's Fundamental Analysis
Adobe peaked intraday its current cycle back in February 2024 at $465.70, but has seen about a year and a half of share erosion since then.
The stock closed Monday at $358.66, down 23% from that February 2024 top and 48.7% from ADBE's $699.54 all-time intraday high of November 2021.
It's also been an up-and-down few weeks for Adobe fundamentally speaking.
First, Morgan Stanley named ADBE, Amazon AMZN and Johnson Controls
  JCI in early August as three stocks that might stand out as large-cap, high-quality adopters as AI plays a central role in their respective business strategies.
But some two weeks later, Dan Ives of Wedbush removed ADBE, C3.ai AI, CyberArk
  CYBR and Elastic
  ESTC from his "IVES AI Revolution 30 list," replacing them with CrowdStrike
  CRWD , Roblox
  RBLX , GE Vernova
  GEV and Nebius
  NBIS .
Still, a day after that, Adobe launched its new AI-powered "Acrobat Studio" globally. The suite offers PDF Spaces, AI Assistant and Adobe Express Premium to customers starting at $24.99 a month.
All of these developments came just shortly ahead of Adobe's fiscal Q3 earnings, which the firm plans to release Thursday after the bell.
Wall Street is expecting Adobe to report $5.18 of adjusted earnings per share for the period on some $5.9 billion of revenue. That would represent an 11.4% gain from the $4.65 of adjusted EPS that Adobe saw in the same period last year, as well as about 9.2% growth from the firm's $5.4 billion in year-ago revenues.
That's a big deal because Adobe has a streak of seven consecutive quarters of double-digit percentages in annual revenue growth going, and a 9.2% y/y gain would break that.
That said, it's not like the Street is down on this stock. Of the 28 sell-side analysts that I can find that cover ADBE, 25 have revised their earnings estimates higher for the latest quarter since the period began. (One analyst cut their estimate, while two made no changes.)
Still, UBS analyst Karl Keirstead (who's rated at five stars out of a possible five by TipRanks), recently reduced his Adobe price target price to $400 from a previous $430. (Keirstead reiterated his hold-equivalent "Neutral" rating on the stock.)
However, Omar Sheikh of Redburn Atlantic last week reiterated his "Sell" rating and $280 target price on the stock. (TipRanks rates Sheik at four stars.)
Adobe's Technical Analysis
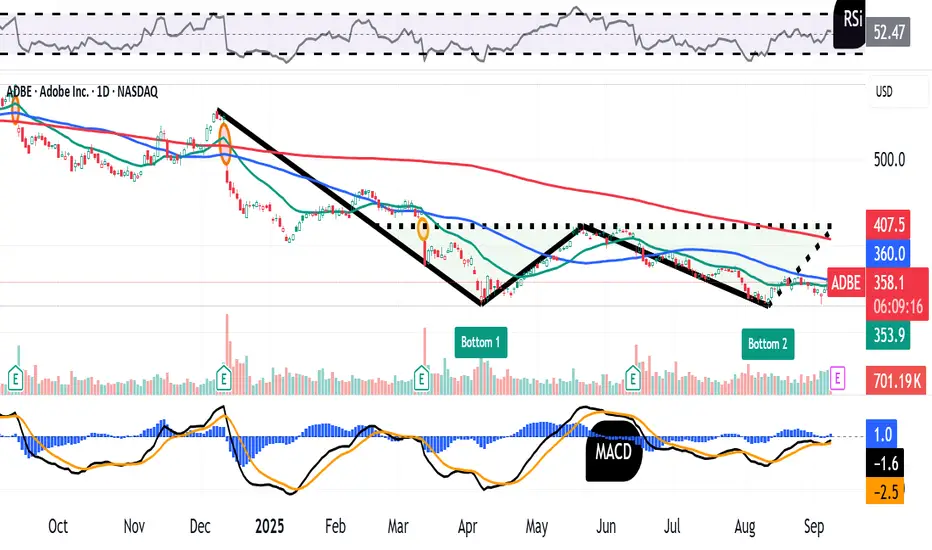
Now let's look at ADBE's one-year chart running through last Thursday:

Readers will notice something potentially disturbing in this chart.
On one hand, ADBE has been building up a "double-bottom" pattern of bullish reversal through all of 2025, as marked with the jagged black line and green boxes above.
This pattern's upside pivot would be the apex of the pattern's center, which is right around $422. That should be a positive set-up.
However, ADBE hit resistance on the way to this rally as the stock approached its 50-day Simple Moving Average (or "SMA," marked with a blue line) in late August. The stock then quickly gave back its 21-day Exponential Moving Average (or "EMA," denoted with a green line).
That apparently turned the swing crowd against Adobe and forced the stock's rally to fail.
Is the attempted rally out of this double bottom truly dead? Not quite -- at least not unless or until the stock makes a new cycle low.
But looking at Adobe's other technical indicators, it seems like there could be more traffic clogging the road ahead.
For instance, the stock's Relative Strength Index (the gray line at the chart's top) is in decline. While not technically oversold, it's been sub-neutral since early to mid-August.
Meanwhile, Adobe's daily Moving Average Convergence Divergence indicator (or "MACD," marked with black and gold lines and blue bars at the chart's bottom) looks quite bearish.
The histogram of the stock's 9-day EMA has moved back into negative territory after having spent a few weeks above the zero-bound.
Additionally, the 12-day EMA (the black line) has crossed back below the 26-day EMA (the gold line). It's typically quite a bearish signal when that happens and both of those lines stand below zero. In fact, both lines have been in negative territory since late June.
All in, this chart brings an old saying to mind: "Approach with caution."
(Moomoo Technologies Inc. Markets Commentator Stephen “Sarge” Guilfoyle had no position in ADBE at the time of writing this column, but did have a long position in CRWD.)
This article discusses technical analysis, other approaches, including fundamental analysis, may offer very different views. The examples provided are for illustrative purposes only and are not intended to be reflective of the results you can expect to achieve. Specific security charts used are for illustrative purposes only and are not a recommendation, offer to sell, or a solicitation of an offer to buy any security. Past investment performance does not indicate or guarantee future success. Returns will vary, and all investments carry risks, including loss of principal. This content is also not a research report and is not intended to serve as the basis for any investment decision. The information contained in this article does not purport to be a complete description of the securities, markets, or developments referred to in this material. Moomoo and its affiliates make no representation or warranty as to the article's adequacy, completeness, accuracy or timeliness for any particular purpose of the above content. Furthermore, there is no guarantee that any statements, estimates, price targets, opinions or forecasts provided herein will prove to be correct.
The Analyst Ratings feature comes from TipRanks, an independent third party. The accuracy, completeness, or reliability cannot be guaranteed and should not be relied upon as a primary basis for any investment decision. The target prices are intended for informational purposes only, not recommendations, and are also not guarantees of future results.
Moomoo is a financial information and trading app offered by Moomoo Technologies Inc. In the U.S., investment products and services on Moomoo are offered by Moomoo Financial Inc., Member FINRA/SIPC.
TradingView is an independent third party not affiliated with Moomoo Financial Inc., Moomoo Technologies Inc., or its affiliates. Moomoo Financial Inc. and its affiliates do not endorse, represent or warrant the completeness and accuracy of the data and information available on the TradingView platform and are not responsible for any services provided by the third-party platform.
Adobe's Fundamental Analysis
Adobe peaked intraday its current cycle back in February 2024 at $465.70, but has seen about a year and a half of share erosion since then.
The stock closed Monday at $358.66, down 23% from that February 2024 top and 48.7% from ADBE's $699.54 all-time intraday high of November 2021.
It's also been an up-and-down few weeks for Adobe fundamentally speaking.
First, Morgan Stanley named ADBE, Amazon
But some two weeks later, Dan Ives of Wedbush removed ADBE, C3.ai
Still, a day after that, Adobe launched its new AI-powered "Acrobat Studio" globally. The suite offers PDF Spaces, AI Assistant and Adobe Express Premium to customers starting at $24.99 a month.
All of these developments came just shortly ahead of Adobe's fiscal Q3 earnings, which the firm plans to release Thursday after the bell.
Wall Street is expecting Adobe to report $5.18 of adjusted earnings per share for the period on some $5.9 billion of revenue. That would represent an 11.4% gain from the $4.65 of adjusted EPS that Adobe saw in the same period last year, as well as about 9.2% growth from the firm's $5.4 billion in year-ago revenues.
That's a big deal because Adobe has a streak of seven consecutive quarters of double-digit percentages in annual revenue growth going, and a 9.2% y/y gain would break that.
That said, it's not like the Street is down on this stock. Of the 28 sell-side analysts that I can find that cover ADBE, 25 have revised their earnings estimates higher for the latest quarter since the period began. (One analyst cut their estimate, while two made no changes.)
Still, UBS analyst Karl Keirstead (who's rated at five stars out of a possible five by TipRanks), recently reduced his Adobe price target price to $400 from a previous $430. (Keirstead reiterated his hold-equivalent "Neutral" rating on the stock.)
However, Omar Sheikh of Redburn Atlantic last week reiterated his "Sell" rating and $280 target price on the stock. (TipRanks rates Sheik at four stars.)
Adobe's Technical Analysis
Now let's look at ADBE's one-year chart running through last Thursday:
Readers will notice something potentially disturbing in this chart.
On one hand, ADBE has been building up a "double-bottom" pattern of bullish reversal through all of 2025, as marked with the jagged black line and green boxes above.
This pattern's upside pivot would be the apex of the pattern's center, which is right around $422. That should be a positive set-up.
However, ADBE hit resistance on the way to this rally as the stock approached its 50-day Simple Moving Average (or "SMA," marked with a blue line) in late August. The stock then quickly gave back its 21-day Exponential Moving Average (or "EMA," denoted with a green line).
That apparently turned the swing crowd against Adobe and forced the stock's rally to fail.
Is the attempted rally out of this double bottom truly dead? Not quite -- at least not unless or until the stock makes a new cycle low.
But looking at Adobe's other technical indicators, it seems like there could be more traffic clogging the road ahead.
For instance, the stock's Relative Strength Index (the gray line at the chart's top) is in decline. While not technically oversold, it's been sub-neutral since early to mid-August.
Meanwhile, Adobe's daily Moving Average Convergence Divergence indicator (or "MACD," marked with black and gold lines and blue bars at the chart's bottom) looks quite bearish.
The histogram of the stock's 9-day EMA has moved back into negative territory after having spent a few weeks above the zero-bound.
Additionally, the 12-day EMA (the black line) has crossed back below the 26-day EMA (the gold line). It's typically quite a bearish signal when that happens and both of those lines stand below zero. In fact, both lines have been in negative territory since late June.
All in, this chart brings an old saying to mind: "Approach with caution."
(Moomoo Technologies Inc. Markets Commentator Stephen “Sarge” Guilfoyle had no position in ADBE at the time of writing this column, but did have a long position in CRWD.)
This article discusses technical analysis, other approaches, including fundamental analysis, may offer very different views. The examples provided are for illustrative purposes only and are not intended to be reflective of the results you can expect to achieve. Specific security charts used are for illustrative purposes only and are not a recommendation, offer to sell, or a solicitation of an offer to buy any security. Past investment performance does not indicate or guarantee future success. Returns will vary, and all investments carry risks, including loss of principal. This content is also not a research report and is not intended to serve as the basis for any investment decision. The information contained in this article does not purport to be a complete description of the securities, markets, or developments referred to in this material. Moomoo and its affiliates make no representation or warranty as to the article's adequacy, completeness, accuracy or timeliness for any particular purpose of the above content. Furthermore, there is no guarantee that any statements, estimates, price targets, opinions or forecasts provided herein will prove to be correct.
The Analyst Ratings feature comes from TipRanks, an independent third party. The accuracy, completeness, or reliability cannot be guaranteed and should not be relied upon as a primary basis for any investment decision. The target prices are intended for informational purposes only, not recommendations, and are also not guarantees of future results.
Moomoo is a financial information and trading app offered by Moomoo Technologies Inc. In the U.S., investment products and services on Moomoo are offered by Moomoo Financial Inc., Member FINRA/SIPC.
TradingView is an independent third party not affiliated with Moomoo Financial Inc., Moomoo Technologies Inc., or its affiliates. Moomoo Financial Inc. and its affiliates do not endorse, represent or warrant the completeness and accuracy of the data and information available on the TradingView platform and are not responsible for any services provided by the third-party platform.
إخلاء المسؤولية
لا يُقصد بالمعلومات والمنشورات أن تكون، أو تشكل، أي نصيحة مالية أو استثمارية أو تجارية أو أنواع أخرى من النصائح أو التوصيات المقدمة أو المعتمدة من TradingView. اقرأ المزيد في شروط الاستخدام.
إخلاء المسؤولية
لا يُقصد بالمعلومات والمنشورات أن تكون، أو تشكل، أي نصيحة مالية أو استثمارية أو تجارية أو أنواع أخرى من النصائح أو التوصيات المقدمة أو المعتمدة من TradingView. اقرأ المزيد في شروط الاستخدام.