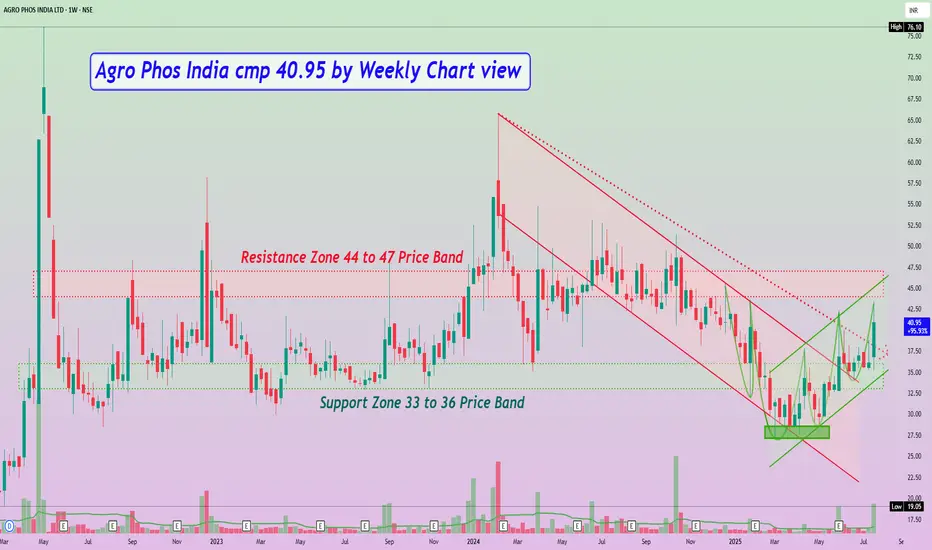
Agro Phos India cmp 40.95 by Weekly Chart view
- Support Zone 33 to 36 Price Band
- Resistance Zone 44 to 47 Price Band
- Falling Price Channel Breakout has well sustained
- Falling Resistance Trendline Breakout too is maintained
- Bullish Double Bottom "W" by repeat Bullish Rounding Bottoms
- Rising Price Channel momentum steadily taking a gradual uptrend
- Volumes have surged heavily over the week above avg traded quantity
- Most common Technical Indicators BB, EMA, MACD, RSI, SAR seen turning positive
إخلاء المسؤولية
لا يُقصد بالمعلومات والمنشورات أن تكون، أو تشكل، أي نصيحة مالية أو استثمارية أو تجارية أو أنواع أخرى من النصائح أو التوصيات المقدمة أو المعتمدة من TradingView. اقرأ المزيد في شروط الاستخدام.
إخلاء المسؤولية
لا يُقصد بالمعلومات والمنشورات أن تكون، أو تشكل، أي نصيحة مالية أو استثمارية أو تجارية أو أنواع أخرى من النصائح أو التوصيات المقدمة أو المعتمدة من TradingView. اقرأ المزيد في شروط الاستخدام.