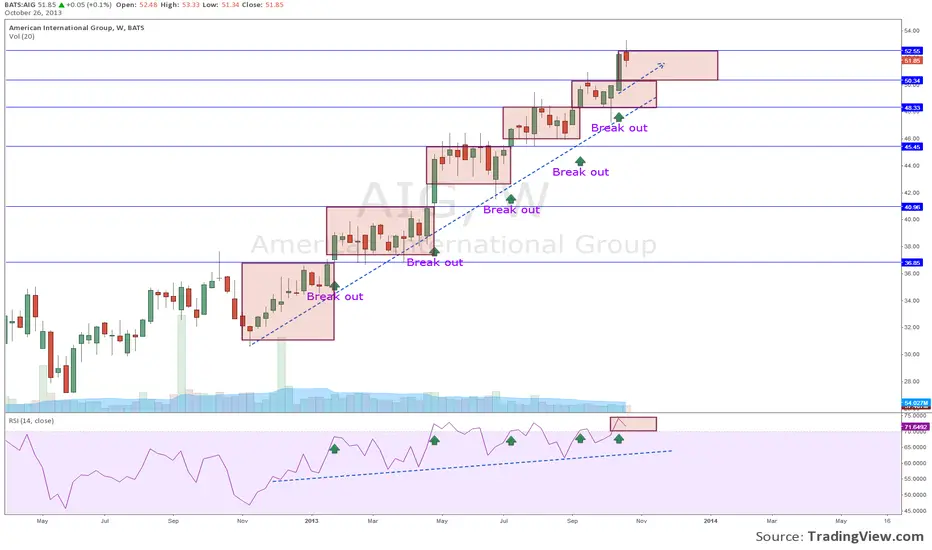
AIG long and strong on the weekly candle.
This is a continuation of a series of previous posted charts .
tradingview.com/v/LCD1fRMj/
tradingview.com/v/KLmqANDH/
tradingview.com/v/kAyKlDdn/
As show here, on weekly chart AIG now broke the resistance at $50.3, into the next zone of consolidation. I expect the RSI to drop a bit (to around 60-70s) before continuing the next leg up. The bullish trend is certainly up and strong.
Disclosure: No position in AIG at the time of analysis
إخلاء المسؤولية
لا يُقصد بالمعلومات والمنشورات أن تكون، أو تشكل، أي نصيحة مالية أو استثمارية أو تجارية أو أنواع أخرى من النصائح أو التوصيات المقدمة أو المعتمدة من TradingView. اقرأ المزيد في شروط الاستخدام.
إخلاء المسؤولية
لا يُقصد بالمعلومات والمنشورات أن تكون، أو تشكل، أي نصيحة مالية أو استثمارية أو تجارية أو أنواع أخرى من النصائح أو التوصيات المقدمة أو المعتمدة من TradingView. اقرأ المزيد في شروط الاستخدام.