⚡ ALB Technical Outlook – Symmetrical Triangle at Key Inflection
Ticker: ALB (Albemarle Corp.)
Timeframe: 30-minute candles
🔍 Current Setup
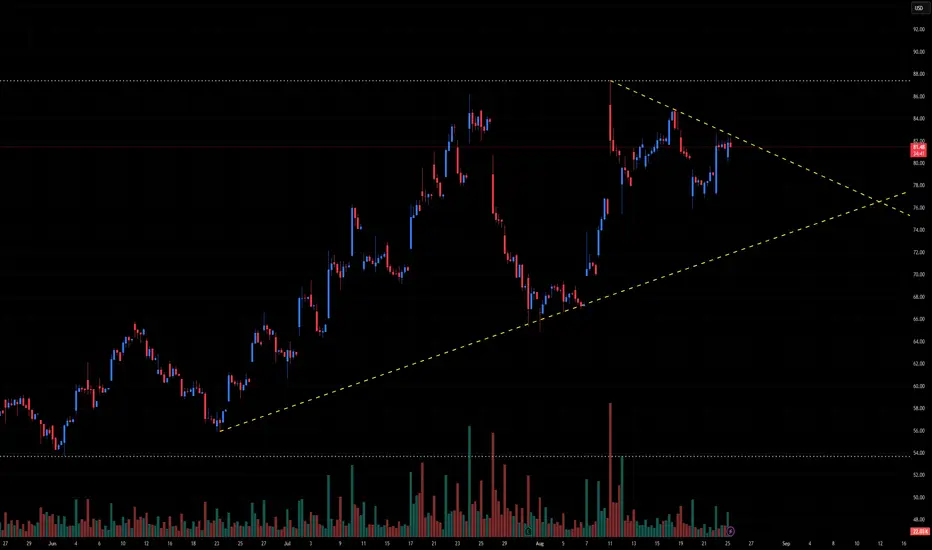
ALB has been in a long-term uptrend, holding an ascending support trendline since late June. After peaking near ~87, price has pulled back and is now consolidating within a symmetrical triangle.
Descending resistance: ~84–85.
Ascending support: ~76–77.
Current price: ~81.40, sitting inside the triangle and nearing the apex.
This structure reflects compression — energy building for a decisive breakout.
📊 Breakout Levels
🚀 Upside (Bullish Scenario)
Trigger: Break and close above 85.
Intermediate Targets:
87–88 → Prior swing high.
90+ → Psychological round number.
Measured Move Target: ~92–94 (triangle height projection).
🔻 Downside (Bearish Scenario)
Trigger: Break below 77, confirmation under 76.
Intermediate Supports:
74–73 → First demand zone.
70–68 → Stronger support.
Measured Move Target: ~67 (triangle height projection downward).
📈 Volume Analysis
Volume has been declining during the triangle formation — normal for consolidation.
Expect a sharp volume expansion once price escapes the triangle.
⚖️ Probability Bias
The broader trend has been upward, which slightly favors a bullish continuation if resistance at 85 is cleared.
However, a failure below 76–77 would invalidate the bullish structure and trigger a breakdown.
✅ Takeaway
ALB is at a critical decision point within a symmetrical triangle:
Bullish Break > 85: Targets 88 → 90 → 92–94
Bearish Break < 76–77: Targets 74 → 70 → 67
The breakout direction — confirmed by volume — will likely define ALB’s next major move.
Ticker: ALB (Albemarle Corp.)
Timeframe: 30-minute candles
🔍 Current Setup
ALB has been in a long-term uptrend, holding an ascending support trendline since late June. After peaking near ~87, price has pulled back and is now consolidating within a symmetrical triangle.
Descending resistance: ~84–85.
Ascending support: ~76–77.
Current price: ~81.40, sitting inside the triangle and nearing the apex.
This structure reflects compression — energy building for a decisive breakout.
📊 Breakout Levels
🚀 Upside (Bullish Scenario)
Trigger: Break and close above 85.
Intermediate Targets:
87–88 → Prior swing high.
90+ → Psychological round number.
Measured Move Target: ~92–94 (triangle height projection).
🔻 Downside (Bearish Scenario)
Trigger: Break below 77, confirmation under 76.
Intermediate Supports:
74–73 → First demand zone.
70–68 → Stronger support.
Measured Move Target: ~67 (triangle height projection downward).
📈 Volume Analysis
Volume has been declining during the triangle formation — normal for consolidation.
Expect a sharp volume expansion once price escapes the triangle.
⚖️ Probability Bias
The broader trend has been upward, which slightly favors a bullish continuation if resistance at 85 is cleared.
However, a failure below 76–77 would invalidate the bullish structure and trigger a breakdown.
✅ Takeaway
ALB is at a critical decision point within a symmetrical triangle:
Bullish Break > 85: Targets 88 → 90 → 92–94
Bearish Break < 76–77: Targets 74 → 70 → 67
The breakout direction — confirmed by volume — will likely define ALB’s next major move.
إخلاء المسؤولية
لا يُقصد بالمعلومات والمنشورات أن تكون، أو تشكل، أي نصيحة مالية أو استثمارية أو تجارية أو أنواع أخرى من النصائح أو التوصيات المقدمة أو المعتمدة من TradingView. اقرأ المزيد في شروط الاستخدام.
إخلاء المسؤولية
لا يُقصد بالمعلومات والمنشورات أن تكون، أو تشكل، أي نصيحة مالية أو استثمارية أو تجارية أو أنواع أخرى من النصائح أو التوصيات المقدمة أو المعتمدة من TradingView. اقرأ المزيد في شروط الاستخدام.