Hello traders 🐺
let's start with the daily chart :

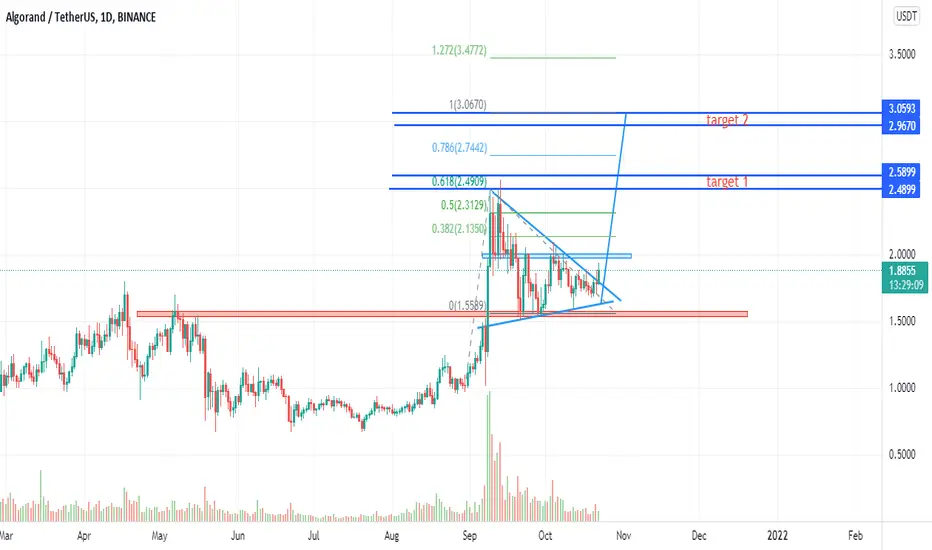
in the daily chart , ALGO formed a triangle pattern , also you can count this as bull flag pattern , no matter how you imagine this price pattern , it's important to learn how we can trade based on this patterns 🤔 .
let's count this as bull flag , you can clearly see during the pattern , volume start to comes down , this is one of the important signs that you must known about the volume , usually during the pattern like picture above , volume comes down and at the break out point we must notice to the volume , because at that point volume must be higher than previous candles ;
but about ALGO , we cant see huge volume at the point of the break out , but it's not mean it isn't a legitimate break out , it means there is chance for bear to create a bull trap , or in other words it could turn into the fake out .
personally prefer to wait for the retest the triangle resistance line or wait for the clear break out from the daily resistance structure ( blue box )
but what is the potential price targets for ALGO🚀 :
the technical target of the FLAG pattern , calculate like below picture :

but I like to use Fibonacci levels to find best points for take profit :

by using the Fibonacci projection we can calculate the price targets ; you can see the 1.0 Fibonacci levels is in alignment with the bull flag pattern , but more importantly the 0.618 is exactly at the previous high , so this is very strong resistance area .
🐺I hope you enjoyed this analysis.
Do not forget to like and subscribe
share my ideas with your friends , thanks for watching my ideas🐺
let's start with the daily chart :
in the daily chart , ALGO formed a triangle pattern , also you can count this as bull flag pattern , no matter how you imagine this price pattern , it's important to learn how we can trade based on this patterns 🤔 .
let's count this as bull flag , you can clearly see during the pattern , volume start to comes down , this is one of the important signs that you must known about the volume , usually during the pattern like picture above , volume comes down and at the break out point we must notice to the volume , because at that point volume must be higher than previous candles ;
but about ALGO , we cant see huge volume at the point of the break out , but it's not mean it isn't a legitimate break out , it means there is chance for bear to create a bull trap , or in other words it could turn into the fake out .
personally prefer to wait for the retest the triangle resistance line or wait for the clear break out from the daily resistance structure ( blue box )
but what is the potential price targets for ALGO🚀 :
the technical target of the FLAG pattern , calculate like below picture :
but I like to use Fibonacci levels to find best points for take profit :
by using the Fibonacci projection we can calculate the price targets ; you can see the 1.0 Fibonacci levels is in alignment with the bull flag pattern , but more importantly the 0.618 is exactly at the previous high , so this is very strong resistance area .
🐺I hope you enjoyed this analysis.
Do not forget to like and subscribe
share my ideas with your friends , thanks for watching my ideas🐺
_____________________________________
🐺 Discipline is rarely enjoyable ,
But almost always profitable 🐺
TElEGRAM CHANNEL : t.me/KIU_COIN
_____________________________________
🐺 Discipline is rarely enjoyable ,
But almost always profitable 🐺
TElEGRAM CHANNEL : t.me/KIU_COIN
_____________________________________
إخلاء المسؤولية
لا يُقصد بالمعلومات والمنشورات أن تكون، أو تشكل، أي نصيحة مالية أو استثمارية أو تجارية أو أنواع أخرى من النصائح أو التوصيات المقدمة أو المعتمدة من TradingView. اقرأ المزيد في شروط الاستخدام.
_____________________________________
🐺 Discipline is rarely enjoyable ,
But almost always profitable 🐺
TElEGRAM CHANNEL : t.me/KIU_COIN
_____________________________________
🐺 Discipline is rarely enjoyable ,
But almost always profitable 🐺
TElEGRAM CHANNEL : t.me/KIU_COIN
_____________________________________
إخلاء المسؤولية
لا يُقصد بالمعلومات والمنشورات أن تكون، أو تشكل، أي نصيحة مالية أو استثمارية أو تجارية أو أنواع أخرى من النصائح أو التوصيات المقدمة أو المعتمدة من TradingView. اقرأ المزيد في شروط الاستخدام.