📈Technical Analysis
Over the last decade, Ambuja steadily climbed from below ₹50 to peak around ₹700 by mid-2024, before slipping to ₹450.
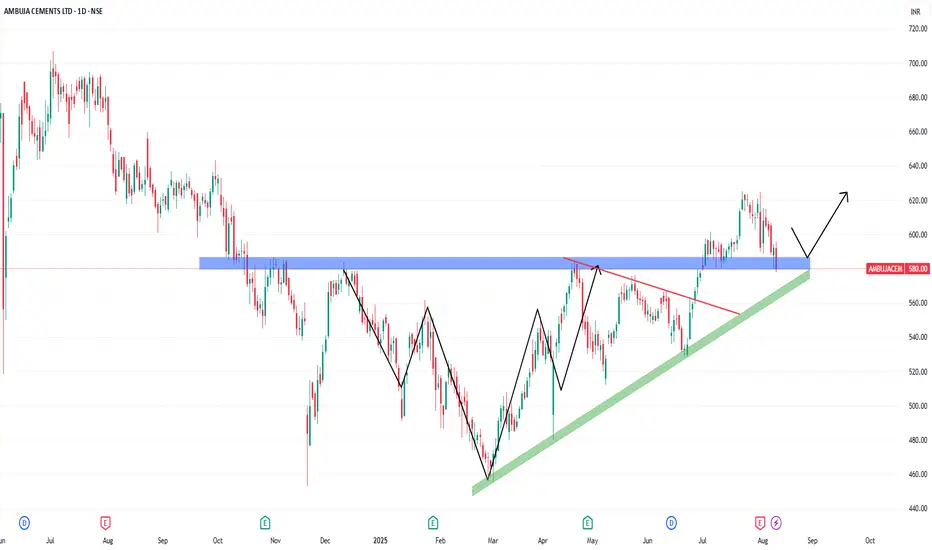
Since then, it formed higher lows and faced resistance around ₹580. With strong FY25 results, it convincingly broke above ₹580, climbed to ₹620, and is now retesting that level.
If ₹580 holds as support with bullish candle confirmation, the next upside targets are:
🎯Target 1: ₹620
🎯Target 2: ₹650
🎯Target 3: ₹680–700
Stop Loss: Below ₹560. If it fails to act as support, the bullish thesis is negated.
💰FY25 Financial Highlights (vs FY24 & FY23)
🧠Fundamental Analysis
Outstanding Q1 FY26 Performance
Ambuja delivered a substantial 24% YoY increase in net profit, posting ₹970 crore pushed by record quarterly sales and strong operational efficiency
Cost and Margin Improvements
EBITDA reached an all-time high of ₹1,961 crore with margins expanding to 19.1%, supported by better pricing and cost optimization
Bottom Line
Ambuja Cements has broken a long-term resistance level at ₹580, supported by stellar FY25 performance. A successful retest could propel the stock towards ₹700. Watch near-term support closely—break below ₹560 could derail the bullish setup.
⚠️Disclaimer
This analysis is for informational purposes only and does not constitute investment advice. Please conduct your own research or consult a financial advisor before investing.
Over the last decade, Ambuja steadily climbed from below ₹50 to peak around ₹700 by mid-2024, before slipping to ₹450.
Since then, it formed higher lows and faced resistance around ₹580. With strong FY25 results, it convincingly broke above ₹580, climbed to ₹620, and is now retesting that level.
If ₹580 holds as support with bullish candle confirmation, the next upside targets are:
🎯Target 1: ₹620
🎯Target 2: ₹650
🎯Target 3: ₹680–700
Stop Loss: Below ₹560. If it fails to act as support, the bullish thesis is negated.
💰FY25 Financial Highlights (vs FY24 & FY23)
- Total Income: ₹35,045 Cr (↑ +6% vs ₹33,160 Cr; ↓ –10% vs ₹38,937 Cr)
- Total Expenses: ₹29,074 Cr (↑ +9% vs ₹26,760 Cr; ↓ –14% vs ₹33,815 Cr)
- Financing Profit: ₹5,971 Cr (↓ –7% vs ₹6,400 Cr; ↑ +17% vs ₹5,122 Cr)
- Profit Before Tax: ₹5,922 Cr (↑ +0.4% vs ₹5,896 Cr; ↑ +59% vs ₹3,729 Cr)
- Profit After Tax: ₹5,158 Cr (↑ +9% vs ₹4,735 Cr; ↑ +70% vs ₹3,024 Cr)
- Diluted EPS: ₹16.92 (↑ from ₹16.26; ↑ from ₹13.01)
🧠Fundamental Analysis
Outstanding Q1 FY26 Performance
Ambuja delivered a substantial 24% YoY increase in net profit, posting ₹970 crore pushed by record quarterly sales and strong operational efficiency
Cost and Margin Improvements
EBITDA reached an all-time high of ₹1,961 crore with margins expanding to 19.1%, supported by better pricing and cost optimization
Bottom Line
Ambuja Cements has broken a long-term resistance level at ₹580, supported by stellar FY25 performance. A successful retest could propel the stock towards ₹700. Watch near-term support closely—break below ₹560 could derail the bullish setup.
⚠️Disclaimer
This analysis is for informational purposes only and does not constitute investment advice. Please conduct your own research or consult a financial advisor before investing.
إخلاء المسؤولية
لا يُقصد بالمعلومات والمنشورات أن تكون، أو تشكل، أي نصيحة مالية أو استثمارية أو تجارية أو أنواع أخرى من النصائح أو التوصيات المقدمة أو المعتمدة من TradingView. اقرأ المزيد في شروط الاستخدام.
إخلاء المسؤولية
لا يُقصد بالمعلومات والمنشورات أن تكون، أو تشكل، أي نصيحة مالية أو استثمارية أو تجارية أو أنواع أخرى من النصائح أو التوصيات المقدمة أو المعتمدة من TradingView. اقرأ المزيد في شروط الاستخدام.