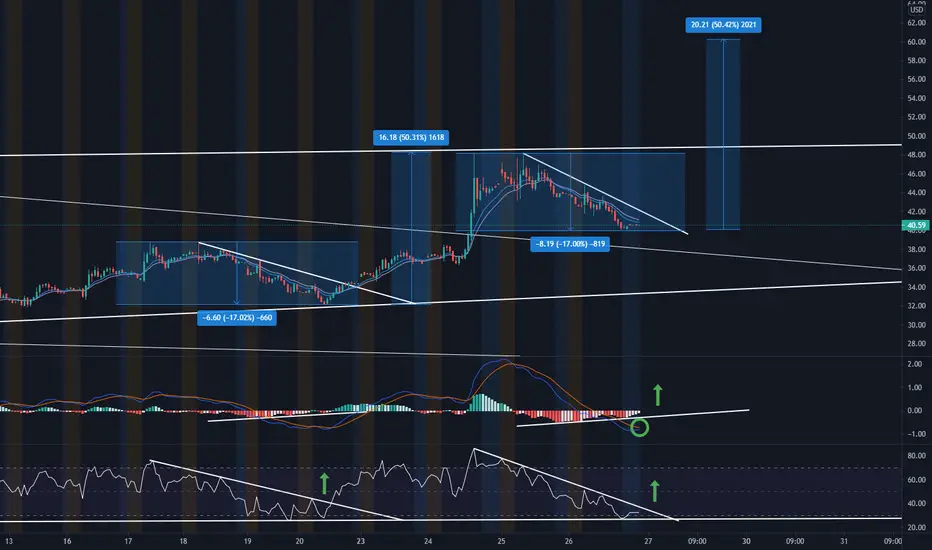
30 Minute Chart
As you can see, previously we dipped down 17% from $39 to $32.
Then we went from $32 all the way to our current highs of $48 around a 50% gain.
We have now seen a drop of around 17% from $48 to $40.
MACD is also showing signs of crossover to upside.
RSI showing a similar trend which we have hit the 30 level on RSI.
In both RSI patterns we have seen a bounce back to the overbought region (+70 RSI).
if we continue this pattern we could see another similar run up around 50% which would make for a 20 pt move from $40 to $60.
Please let me know what you guys think ! All comments welcome.
Leave a like if you enjoyed this setup.
ملاحظة
$40 to $44 so far!ملاحظة
$40.59 to $48! Looking ready to test $48 level!Join Smarter Traders 🧠 discord.gg/t8vkMapQ3m
إخلاء المسؤولية
لا يُقصد بالمعلومات والمنشورات أن تكون، أو تشكل، أي نصيحة مالية أو استثمارية أو تجارية أو أنواع أخرى من النصائح أو التوصيات المقدمة أو المعتمدة من TradingView. اقرأ المزيد في شروط الاستخدام.
Join Smarter Traders 🧠 discord.gg/t8vkMapQ3m
إخلاء المسؤولية
لا يُقصد بالمعلومات والمنشورات أن تكون، أو تشكل، أي نصيحة مالية أو استثمارية أو تجارية أو أنواع أخرى من النصائح أو التوصيات المقدمة أو المعتمدة من TradingView. اقرأ المزيد في شروط الاستخدام.