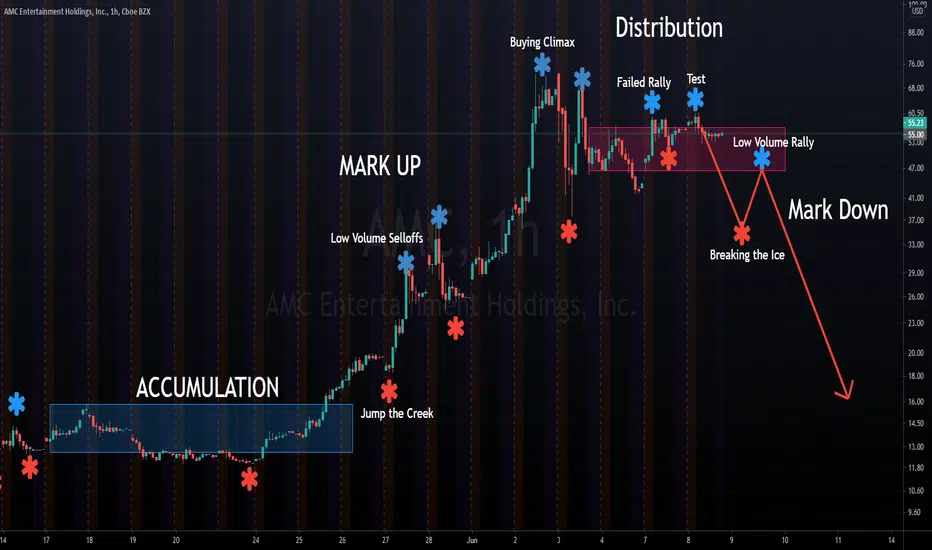
I'm still learning the ropes and this morning was Wyckoff. Found a good chart after some googling, here's the jpg. In order to internalize what I learned, I decided to compare it to something that's moving a lot, like AMC.
It's perfect, which is scary. Open the pic and compare, but make up your own mind. I'm still pretty green. Level to watch for is $45
It's perfect, which is scary. Open the pic and compare, but make up your own mind. I'm still pretty green. Level to watch for is $45
ملاحظة
Update: 6/11Just updating for accountability, and to see if there's anything to learn
Not sure exactly what to make of this, but here's a few things I'm noticing.
1. Slope is shallower than expected.
2. Following the same basic shape.
3. There hasn't really been another rally similar to the $70 high, as we expect
So, maybe we just finished the low volume rally and are currently about to plummet. Maybe we haven't done the failed rally, and the area between that and the climax is longer than normal for whatever reason. Maybe we're on our way to break the ice back at $35. Or maybe this is all nonsense and I'm trying to make something fit a predefined patter.
منشورات ذات صلة
إخلاء المسؤولية
لا يُقصد بالمعلومات والمنشورات أن تكون، أو تشكل، أي نصيحة مالية أو استثمارية أو تجارية أو أنواع أخرى من النصائح أو التوصيات المقدمة أو المعتمدة من TradingView. اقرأ المزيد في شروط الاستخدام.
منشورات ذات صلة
إخلاء المسؤولية
لا يُقصد بالمعلومات والمنشورات أن تكون، أو تشكل، أي نصيحة مالية أو استثمارية أو تجارية أو أنواع أخرى من النصائح أو التوصيات المقدمة أو المعتمدة من TradingView. اقرأ المزيد في شروط الاستخدام.