🔹 Definition
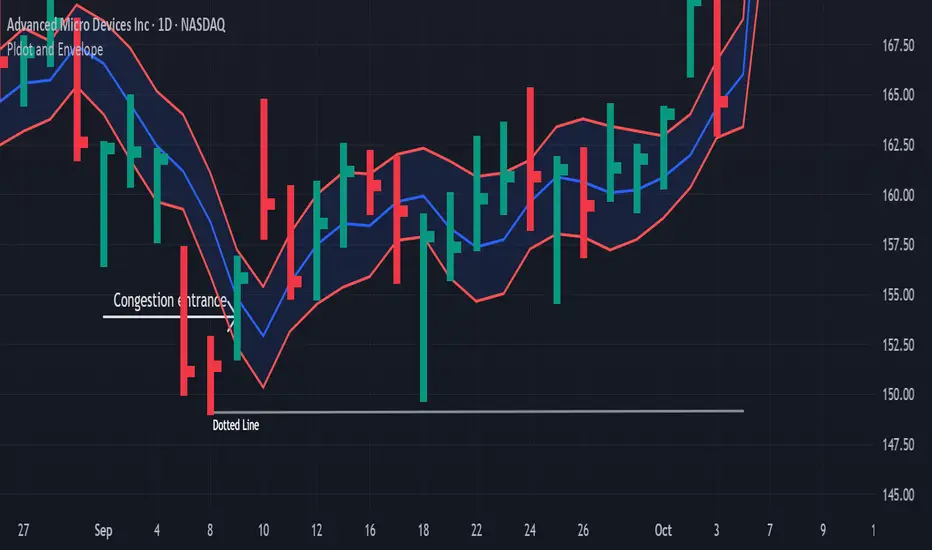
The Dotted Line marks the termination of a prior trend.
It’s drawn at the highest high of an uptrend or the lowest low of a downtrend.
Together with the Block Level, it defines the outer edge of congestion — where trend energy has been spent and the market is preparing to shift direction.

When the dotted line begins to appear, it signals that momentum is fading and buyers or sellers are losing control.
⚙️ How the Dotted Line Sets Up
A dotted line setup develops through a series of termination events — signs that price can no longer advance in the direction of the trend.
Multiple 5-9 terminations begin holding on close.
This clustering shows price repeatedly failing to continue.

After 5-9s, a 5-2 termination starts to hold — often from one or two bars back.

If no 5-2s are visible, a 5-1 termination may take over, often combined with a 1-1 zone for added resistance or support.

A 6-1 termination then confirms the exhaustion phase.

Any existing c-wave (momentum thrust) will stop immediately — energy has run its course.

The envelope confines (top or bottom) begin to hold against the trend. This marks the containment of price movement.

If price reaches a further-out area, it typically converts to a nearby zone on the next bar — energy compresses inward.
The setup is confirmed only when the nearby support or resistance holds.
⚖️ Nearby Support and Resistance
“Nearby” zones are the areas of immediate price engagement — where short-term pressure builds and releases.
They are formed from:
Interpretation Guide:
If Close > Envelope Top → nearby support lies between the Envelope Top and PL Dot.
If Close < Envelope Bottom → nearby resistance lies between the Envelope Bottom and PL Dot.
When price is inside the envelope, the PL Dot serves as the market’s balance point.
🧩 Summary
The Dotted Line marks the end of a move — a termination zone, not a breakout.
When it forms:
This is where trend energy fades and the next structure begins —
a pause, reversal, or new congestion phase.
The Dotted Line marks the termination of a prior trend.
It’s drawn at the highest high of an uptrend or the lowest low of a downtrend.
Together with the Block Level, it defines the outer edge of congestion — where trend energy has been spent and the market is preparing to shift direction.
When the dotted line begins to appear, it signals that momentum is fading and buyers or sellers are losing control.
⚙️ How the Dotted Line Sets Up
A dotted line setup develops through a series of termination events — signs that price can no longer advance in the direction of the trend.
Multiple 5-9 terminations begin holding on close.
This clustering shows price repeatedly failing to continue.
After 5-9s, a 5-2 termination starts to hold — often from one or two bars back.
If no 5-2s are visible, a 5-1 termination may take over, often combined with a 1-1 zone for added resistance or support.
A 6-1 termination then confirms the exhaustion phase.
Any existing c-wave (momentum thrust) will stop immediately — energy has run its course.
The envelope confines (top or bottom) begin to hold against the trend. This marks the containment of price movement.
If price reaches a further-out area, it typically converts to a nearby zone on the next bar — energy compresses inward.
The setup is confirmed only when the nearby support or resistance holds.
⚖️ Nearby Support and Resistance
“Nearby” zones are the areas of immediate price engagement — where short-term pressure builds and releases.
They are formed from:
- PL Dot or Live PL Dot
- 1-1 zones
- 5-9, 5-2, 5-1, 6-1 terminations
- Envelope borders and main channel lines
Interpretation Guide:
If Close > Envelope Top → nearby support lies between the Envelope Top and PL Dot.
If Close < Envelope Bottom → nearby resistance lies between the Envelope Bottom and PL Dot.
When price is inside the envelope, the PL Dot serves as the market’s balance point.
🧩 Summary
The Dotted Line marks the end of a move — a termination zone, not a breakout.
When it forms:
- Terminations (5-9 → 5-2 → 5-1 → 6-1) appear in sequence.
- The c-wave loses strength.
- The envelope contains price.
- Nearby levels begin to hold.
This is where trend energy fades and the next structure begins —
a pause, reversal, or new congestion phase.
إخلاء المسؤولية
The information and publications are not meant to be, and do not constitute, financial, investment, trading, or other types of advice or recommendations supplied or endorsed by TradingView. Read more in the Terms of Use.
إخلاء المسؤولية
The information and publications are not meant to be, and do not constitute, financial, investment, trading, or other types of advice or recommendations supplied or endorsed by TradingView. Read more in the Terms of Use.