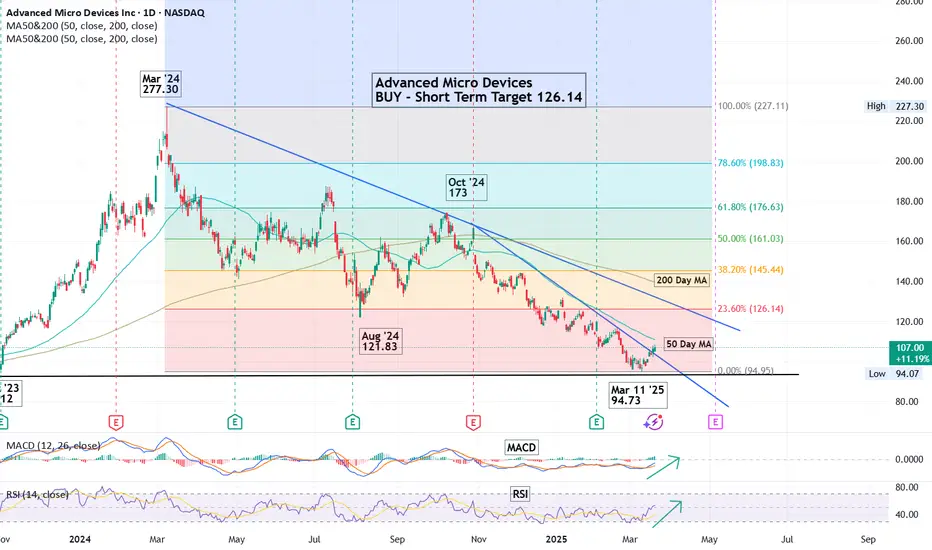
Trendline: Downtrend, connect lower highs and draw a line.
Fibonacci Retracements: High to Low for the period will show where the potential resistance
levels are.
Support Levels: Price held support from previous levels.
For Educational Purposes Only. Not a recommendation to buy or sell.
Fibonacci Retracements: High to Low for the period will show where the potential resistance
levels are.
Support Levels: Price held support from previous levels.
For Educational Purposes Only. Not a recommendation to buy or sell.
إخلاء المسؤولية
لا يُقصد بالمعلومات والمنشورات أن تكون، أو تشكل، أي نصيحة مالية أو استثمارية أو تجارية أو أنواع أخرى من النصائح أو التوصيات المقدمة أو المعتمدة من TradingView. اقرأ المزيد في شروط الاستخدام.
إخلاء المسؤولية
لا يُقصد بالمعلومات والمنشورات أن تكون، أو تشكل، أي نصيحة مالية أو استثمارية أو تجارية أو أنواع أخرى من النصائح أو التوصيات المقدمة أو المعتمدة من TradingView. اقرأ المزيد في شروط الاستخدام.