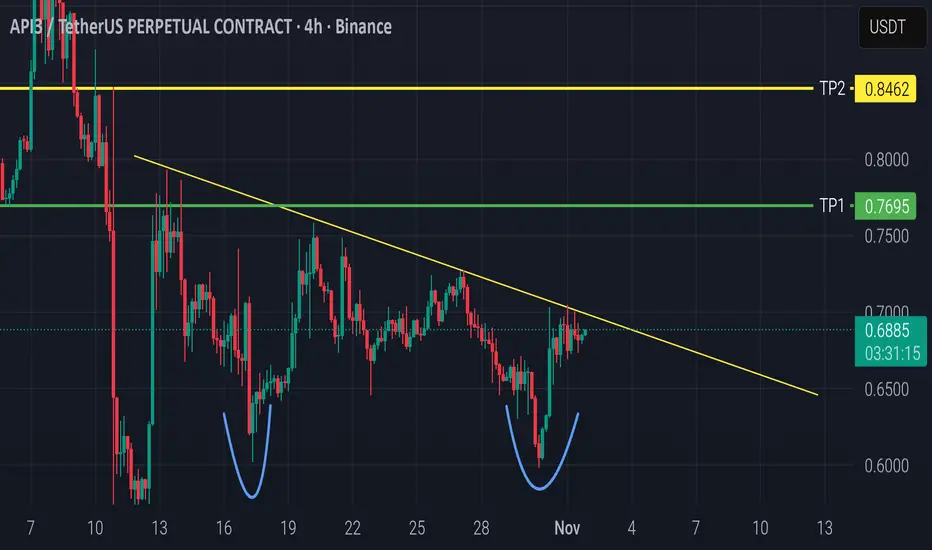
The chart shows a clear Double Bottom pattern around the 0.60 zone, indicating a potential bullish reversal.
Price is now testing the descending trendline (neckline), and a confirmed 4H candle close above 0.69 with strong volume could trigger a breakout move.
🎯 Targets:
TP1: 0.7412
TP2: 0.8462
🛡️ Stop Loss: Below 0.67 or the previous low.
Volume is increasing, supporting the potential breakout — so entry can be considered now if volume keeps rising, or after a retest of the trendline for safer confirmation.
#API3USDT #Crypto #TradingView #TechnicalAnalysis #DoubleBottom #TrendlineBreakout
إخلاء المسؤولية
لا يُقصد بالمعلومات والمنشورات أن تكون، أو تشكل، أي نصيحة مالية أو استثمارية أو تجارية أو أنواع أخرى من النصائح أو التوصيات المقدمة أو المعتمدة من TradingView. اقرأ المزيد في شروط الاستخدام.
إخلاء المسؤولية
لا يُقصد بالمعلومات والمنشورات أن تكون، أو تشكل، أي نصيحة مالية أو استثمارية أو تجارية أو أنواع أخرى من النصائح أو التوصيات المقدمة أو المعتمدة من TradingView. اقرأ المزيد في شروط الاستخدام.