As per the Latest SEBI Mandate, this isn't a Trading/Investment RECOMMENDATION nor for Educational Purposes; it is just for Informational purposes only. The chart data used is 3 Months old, as Showing Live Chart Data is not allowed according to the New SEBI Mandate.
Disclaimer: "I am not a SEBI REGISTERED RESEARCH ANALYST AND INVESTMENT ADVISER."
This analysis is intended solely for informational purposes and should not be interpreted as financial advice. It is advisable to consult a qualified financial advisor or conduct thorough research before making investment decisions.
Price Action:
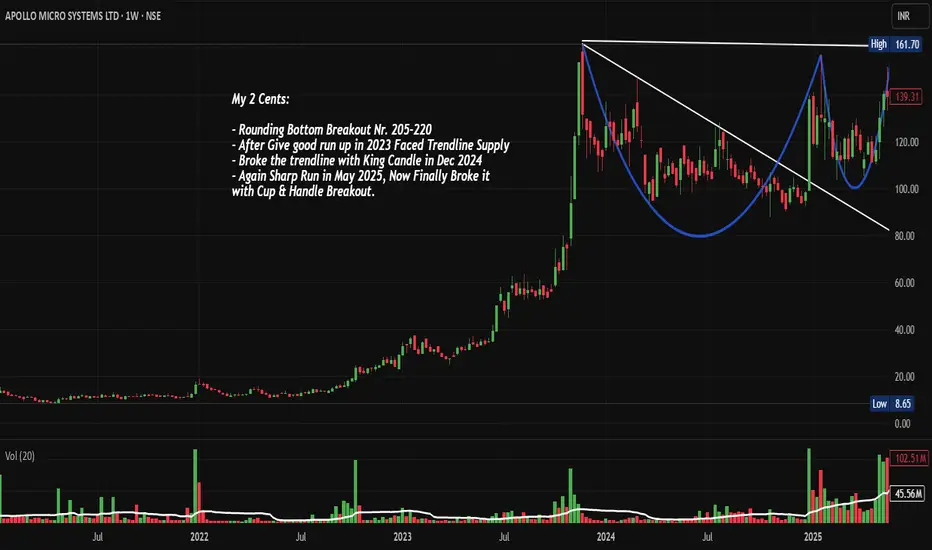
• The chart reveals a sophisticated Cup and Handle pattern formation spanning from Late-2023 to August 2025, with the "cup" forming between 205-160 levels and the "handle" consolidating around the 180-200 zone
• Multiple breakout attempts were witnessed - first in December 2024 with a King Candle formation, followed by another sharp rally in May 2025, both failing to sustain above the descending trendline
• The current August 2025 breakout represents the third and most convincing attempt, breaking through both the descending resistance trendline and the horizontal resistance at 205-220 levels
• Volume surge during the current breakout (119.95M vs average 54.33M) confirms institutional participation and validates the breakout authenticity
• The curved line clearly marks the rounding bottom formation, indicating a gradual shift from bearish to bullish sentiment
Volume Spread Analysis:
Volume Pattern Insights:
• Exceptional volume breakout with nearly 2.2x average daily volume during the recent surge
• Volume accumulation visible during the cup formation, indicating smart money participation
• Low volume during handle formation, suggesting healthy consolidation
• Volume expansion coinciding with price breakout confirms institutional buying
Key Support and Resistance:
• Immediate Support Zones:
- Primary: 220-225 (previous resistance turned support)
- Secondary: 200-205 (handle formation base)
- Major: 180-185 (cup formation low)
• Critical Resistance Levels:
- Near-term: 250-260 (measured move target from cup depth)
- Intermediate: 280-290 (Fibonacci extension 1.618 level)
- Long-term: 320-340 (cup and handle pattern target)
• Base Formation: Strong accumulation base established between 160-220 over 18+ months
Multi-Pattern Technical Setup:
• Cup and Handle Pattern: Classic bullish continuation pattern with 18-month formation period
• Descending Triangle Breakout: Successfully breached the falling trendline resistance
• Rounding Bottom: Long-term reversal pattern indicating strong institutional accumulation
• Volume Breakout Pattern: Exceptional volume expansion confirming price breakout validity
Fundamental and Sectoral Backdrop:
Latest Financial Performance:
• Net profit surged 126% to Rs 19 crore in Q1 FY2026 compared to Rs 8 crore in Q1 FY2025
• Revenue growth of 46.5% to Rs 134 crore versus Rs 91 crore in the previous year, same quarter
• Quarterly growth basis shows a 32.21% jump in net profits since last quarter
• Market capitalization stands at approximately Rs 7,854 crores, reflecting strong market confidence
Strategic Business Positioning:
• Company is involved in more than 150 indigenous defence programs and 60 DcPP (Defence Capital Procurement Policy) programs as a sub-system partner
• Specializes in ruggedized electronic hardware and software solutions for critical sectors
• Strong focus on import substitution and Atmanirbhar Bharat initiatives
• Diversified client base including DRDO, HAL, BEL, and other major defence contractors
Sector Momentum Analysis:
• Apollo Micro Systems gained 14.6% on August 22, 2025, demonstrating resilience amid market fluctuations
• Stock has significantly outperformed the broader market year-to-date, reflecting strong performance in the Aerospace & Defence sector
• Defence budget allocation increases continue to provide sectoral tailwinds
• Growing focus on indigenous defence manufacturing creates long-term opportunities
Market Participation Analysis:
• High institutional interest is evident from volume patterns
• Retail participation is likely to increase given the breakout visibility
• Options activity expected to increase as the stock approaches higher price levels
• Potential inclusion in small-cap/midcap indices could trigger passive fund buying
Risk Assessment and Scenario Analysis:
Technical Risk Factors:
• Failed breakout history (December 2024 and May 2025) suggests caution is required
• High beta nature means increased volatility during market corrections
• Potential for profit booking at psychologically important 250 levels
• Need for sustained volume to validate the breakout authenticity
Fundamental Risk Considerations:
• Defence sector dependency on government policy changes and budget allocations
• Long procurement cycles are typical in defence contracts, affecting quarterly results
• Competition from established defence majors and emerging players
• Currency fluctuation impact on imported components and raw materials
Full Coverage on my Newsletter this Week
Keep in the Watchlist and DOYR.
NO RECO. For Buy/Sell.
📌Thank you for exploring my idea! I hope you found it valuable.
🙏FOLLOW for more
👍BOOST if you found it useful.
✍️COMMENT below with your views.
Meanwhile, check out my other stock ideas on the right side until this trade is activated. I would love your feedback.
As per the Latest SEBI Mandate, this isn't a Trading/Investment RECOMMENDATION nor for Educational Purposes, it is just for Informational purposes only. The chart data used is 3 Months old, as Showing Live Chart Data is not allowed according to the New SEBI Mandate.
Disclaimer: "I am not a SEBI REGISTERED RESEARCH ANALYST AND INVESTMENT ADVISER."
This analysis is intended solely for informational purposes and should not be interpreted as financial advice. It is advisable to consult a qualified financial advisor or conduct thorough research before making investment decisions.
تم فتح الصفقة
- Intermediate: 280-290 (Fibonacci extension 1.618 level) Doneمنشورات ذات صلة
إخلاء المسؤولية
لا يُقصد بالمعلومات والمنشورات أن تكون، أو تشكل، أي نصيحة مالية أو استثمارية أو تجارية أو أنواع أخرى من النصائح أو التوصيات المقدمة أو المعتمدة من TradingView. اقرأ المزيد في شروط الاستخدام.
منشورات ذات صلة
إخلاء المسؤولية
لا يُقصد بالمعلومات والمنشورات أن تكون، أو تشكل، أي نصيحة مالية أو استثمارية أو تجارية أو أنواع أخرى من النصائح أو التوصيات المقدمة أو المعتمدة من TradingView. اقرأ المزيد في شروط الاستخدام.