APT has been trading sideways for the past 248 days, building a massive base of consolidation. Things are starting to get interesting.
Recently, APT made its first real attempt to break above the yearly VWAP core (~$5.6) but got rejected, completing a 5-wave impulse right at this resistance zone. The rejection was no surprise: it lined up perfectly with the VAH of the 248-day trading range and the 4B market cap resistance at $5.69.
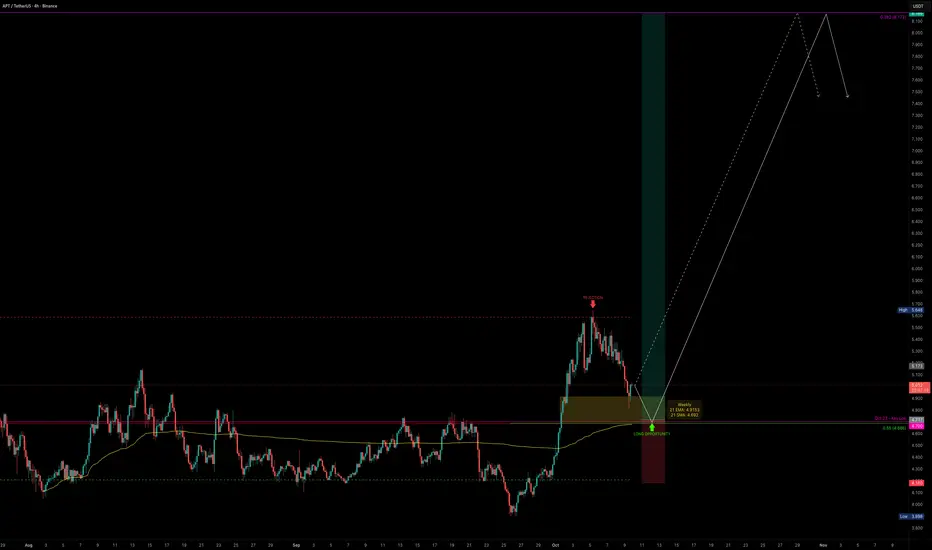
Now, after a strong impulse, we are in correction mode and this could set up the next major swing long opportunity.
🟢 Support Confluence Zone ($5.0–$4.5)
All confluences point to this being a critical support zone that bulls must defend.
🔴 Resistance Zone ($5.6–$5.7)
This zone remains the big wall to break. Once cleared with strong volume, upside potential opens significantly.
Freshly built (unpublished) Anchored VWAP Suite [SiDec], which provides VWAP tracking:

Fair Value Trend Model [SiDec]:

Trade Setup
Quick Take
APT is sitting at one of the most important support zones of the year. If this base holds, it sets up a high-probability swing long with great upside potential. All eyes are on whether bulls can reclaim momentum and finally break through the $5.7 wall.
🔍 Indicators used
➡️ Available for free. You can find it on my profile under “Scripts” and apply it directly to your charts for extra confluence when planning your trades.
_________________________________
💬 If you found this helpful, drop a like and comment!
Recently, APT made its first real attempt to break above the yearly VWAP core (~$5.6) but got rejected, completing a 5-wave impulse right at this resistance zone. The rejection was no surprise: it lined up perfectly with the VAH of the 248-day trading range and the 4B market cap resistance at $5.69.
Now, after a strong impulse, we are in correction mode and this could set up the next major swing long opportunity.
🟢 Support Confluence Zone ($5.0–$4.5)
- POC of 248-day range: $4.685
- Anchored VWAP (from Aug low): sits right at the POC
- Key Low (Oct 2023): $4.70
- 0.55 Fib retracement (of 5-wave impulse): $4.686
- 21 Daily EMA/SMA: $4.847 / $4.7
- 21 Weekly EMA/SMA: $4.915 / $4.69
- 200 4H EMA/SMA: $4.7 / $4.582
All confluences point to this being a critical support zone that bulls must defend.
🔴 Resistance Zone ($5.6–$5.7)
- Yearly VWAP core (~$5.6)
- VAH of 248-day range (~$5.6)
- 4B Market Cap resistance (~$5.69)
This zone remains the big wall to break. Once cleared with strong volume, upside potential opens significantly.
Freshly built (unpublished) Anchored VWAP Suite [SiDec], which provides VWAP tracking:
Fair Value Trend Model [SiDec]:
Trade Setup
- Long Entry: Ladder between $5.0–$4.5
- Invalidation: Below VAL of range
- Targets: $5.7 (major resistance), $7 (Fair Value), $8.172 (0.382 Fib)
- Potential swing setup with R:R of 1:6+
- Possible gain of +70% if structure holds and volume confirms breakout
Quick Take
APT is sitting at one of the most important support zones of the year. If this base holds, it sets up a high-probability swing long with great upside potential. All eyes are on whether bulls can reclaim momentum and finally break through the $5.7 wall.
🔍 Indicators used
- Multi Timeframe 8x MA Support Resistance Zones [SiDec] → to identify support and resistance zones such as the weekly 21 EMA/SMA.
- Fair Value Trend Model [SiDec] → Calculates a regression-based fair value curve
➡️ Available for free. You can find it on my profile under “Scripts” and apply it directly to your charts for extra confluence when planning your trades.
_________________________________
💬 If you found this helpful, drop a like and comment!
🏆 Mastering Fibonacci for precision trading
🔹 Sharing high-probability trade setups
⚡ Unlock the power of technical analysis!
🔹 Sharing high-probability trade setups
⚡ Unlock the power of technical analysis!
إخلاء المسؤولية
لا يُقصد بالمعلومات والمنشورات أن تكون، أو تشكل، أي نصيحة مالية أو استثمارية أو تجارية أو أنواع أخرى من النصائح أو التوصيات المقدمة أو المعتمدة من TradingView. اقرأ المزيد في شروط الاستخدام.