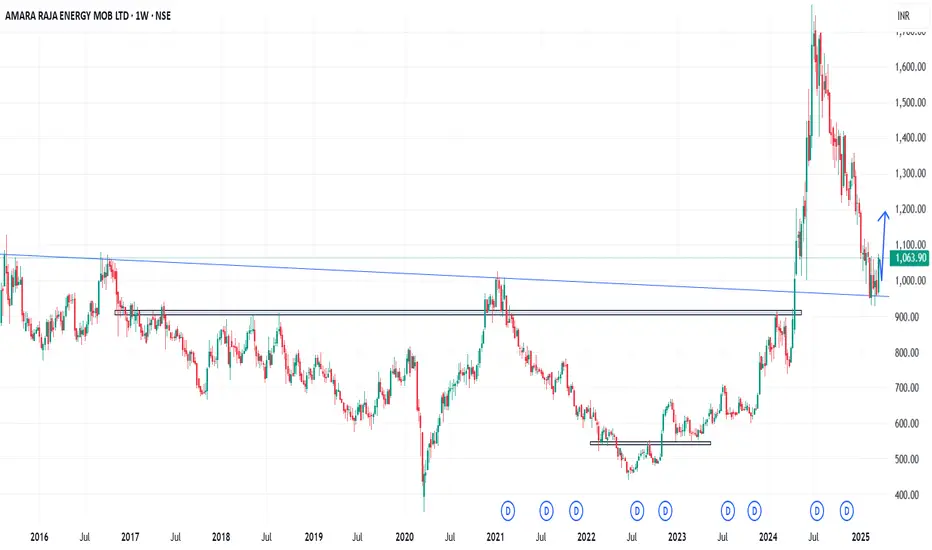
In the Weekly Chart of ARE&M ,
we can see that; it has given a strong bounce back from Support Trendline.
Let it create one or two halt candle and then up move might continue.
Expected momentum is shown in chart.
we can see that; it has given a strong bounce back from Support Trendline.
Let it create one or two halt candle and then up move might continue.
Expected momentum is shown in chart.
إخلاء المسؤولية
لا يُقصد بالمعلومات والمنشورات أن تكون، أو تشكل، أي نصيحة مالية أو استثمارية أو تجارية أو أنواع أخرى من النصائح أو التوصيات المقدمة أو المعتمدة من TradingView. اقرأ المزيد في شروط الاستخدام.
إخلاء المسؤولية
لا يُقصد بالمعلومات والمنشورات أن تكون، أو تشكل، أي نصيحة مالية أو استثمارية أو تجارية أو أنواع أخرى من النصائح أو التوصيات المقدمة أو المعتمدة من TradingView. اقرأ المزيد في شروط الاستخدام.