📊 Weekly Support & Resistance Levels
Support Levels:
S1: ₹2,524.63
S2: ₹2,502.97
S3: ₹2,481.13
S4: ₹2,452.73
Central Pivot: ₹2,553.57
Resistance Levels:
R1: ₹2,568.13
R2: ₹2,589.97
R3: ₹2,611.63
R4: ₹2,647.13
Central Pivot: ₹2,553.57
📈 Technical Indicators (Weekly Timeframe)
Relative Strength Index (RSI): Indicates a bullish trend.
Moving Average Convergence Divergence (MACD): Shows a bullish crossover, supporting upward momentum.
Moving Averages: Both 50-day and 200-day moving averages are trending upwards, confirming a positive short-term outlook.
Pivot Points: Trading above the central pivot suggests a bullish bias.
🔍 Observations
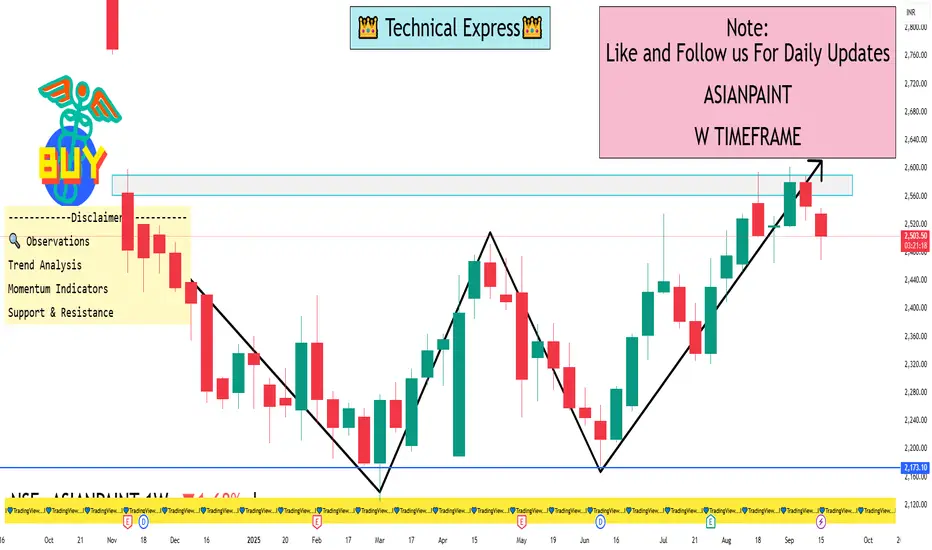
Asian Paints has been trading within a parallel channel since May 2021. A significant gap-down breakdown occurred in November 2024, followed by a series of bearish candles. If the current momentum persists, further downward movement is possible. However, the stock is approaching key support levels, which may act as a cushion against further declines.
Support Levels:
S1: ₹2,524.63
S2: ₹2,502.97
S3: ₹2,481.13
S4: ₹2,452.73
Central Pivot: ₹2,553.57
Resistance Levels:
R1: ₹2,568.13
R2: ₹2,589.97
R3: ₹2,611.63
R4: ₹2,647.13
Central Pivot: ₹2,553.57
📈 Technical Indicators (Weekly Timeframe)
Relative Strength Index (RSI): Indicates a bullish trend.
Moving Average Convergence Divergence (MACD): Shows a bullish crossover, supporting upward momentum.
Moving Averages: Both 50-day and 200-day moving averages are trending upwards, confirming a positive short-term outlook.
Pivot Points: Trading above the central pivot suggests a bullish bias.
🔍 Observations
Asian Paints has been trading within a parallel channel since May 2021. A significant gap-down breakdown occurred in November 2024, followed by a series of bearish candles. If the current momentum persists, further downward movement is possible. However, the stock is approaching key support levels, which may act as a cushion against further declines.
I built a Buy & Sell Signal Indicator with 85% accuracy.
📈 Get access via DM or
WhatsApp: wa.link/d997q0
| Email: techncialexpress@gmail.com
| Script Coder | Trader | Investor | From India
📈 Get access via DM or
WhatsApp: wa.link/d997q0
| Email: techncialexpress@gmail.com
| Script Coder | Trader | Investor | From India
منشورات ذات صلة
إخلاء المسؤولية
لا يُقصد بالمعلومات والمنشورات أن تكون، أو تشكل، أي نصيحة مالية أو استثمارية أو تجارية أو أنواع أخرى من النصائح أو التوصيات المقدمة أو المعتمدة من TradingView. اقرأ المزيد في شروط الاستخدام.