Asian Paints – Daily Chart Analysis
Chart Timeframe: Daily chart observation.
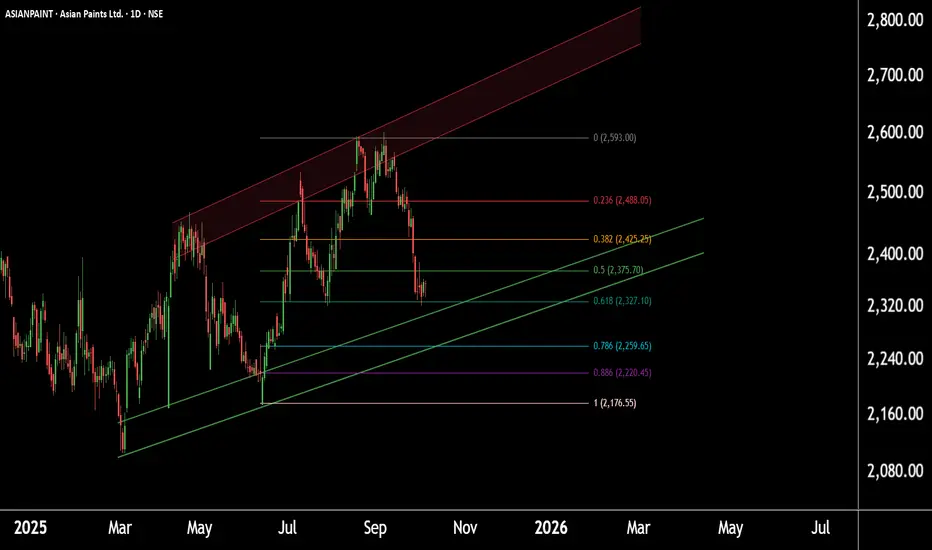
Current Price Zone: Trading near the Fibonacci golden zone around 2320.
Support Zone: Strong support identified between 2240–2260, aligned with the channel base and Fibonacci retracement.
Technical Confluence: Both channel and Fibonacci levels confirm 2260 as a crucial support level.
Outlook: If these two zones hold, we may see higher prices in Asian Paints in the upcoming sessions.
Thank you.
Chart Timeframe: Daily chart observation.
Current Price Zone: Trading near the Fibonacci golden zone around 2320.
Support Zone: Strong support identified between 2240–2260, aligned with the channel base and Fibonacci retracement.
Technical Confluence: Both channel and Fibonacci levels confirm 2260 as a crucial support level.
Outlook: If these two zones hold, we may see higher prices in Asian Paints in the upcoming sessions.
Thank you.
@RahulSaraoge
Connect us at t.me/stridesadvisory
Connect us at t.me/stridesadvisory
إخلاء المسؤولية
لا يُقصد بالمعلومات والمنشورات أن تكون، أو تشكل، أي نصيحة مالية أو استثمارية أو تجارية أو أنواع أخرى من النصائح أو التوصيات المقدمة أو المعتمدة من TradingView. اقرأ المزيد في شروط الاستخدام.
@RahulSaraoge
Connect us at t.me/stridesadvisory
Connect us at t.me/stridesadvisory
إخلاء المسؤولية
لا يُقصد بالمعلومات والمنشورات أن تكون، أو تشكل، أي نصيحة مالية أو استثمارية أو تجارية أو أنواع أخرى من النصائح أو التوصيات المقدمة أو المعتمدة من TradingView. اقرأ المزيد في شروط الاستخدام.