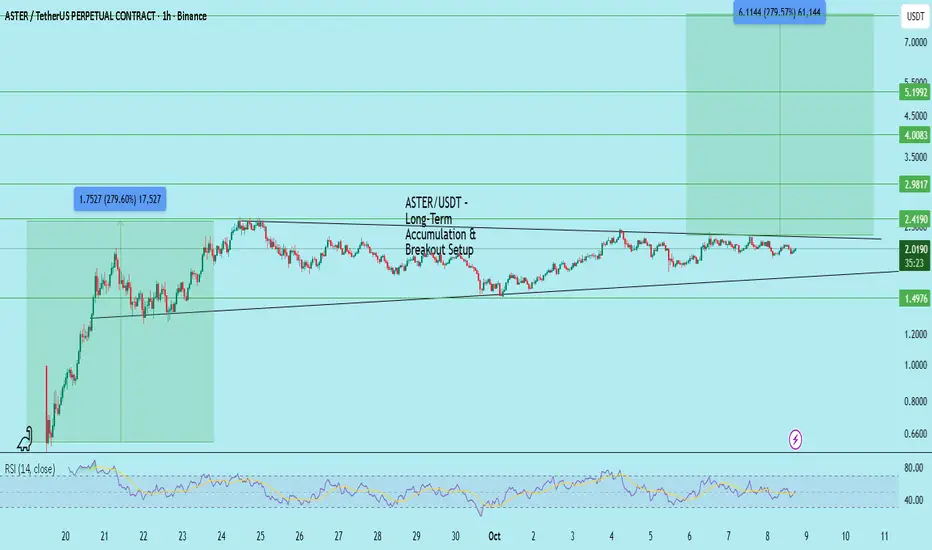
ASTER has been consolidating within an ascending structure after its previous 279% rally. Price action shows strong demand near the 1.6–1.8 support range, with higher lows forming consistently — indicating accumulation by stronger hands.
The structure appears to be forming a broad ascending triangle or channel, where repeated tests of the upper boundary suggest pressure building for a potential breakout continuation. RSI remains neutral around 50, showing that there’s no overbought stress, allowing more upside momentum once volume confirms.
Technical Overview
Entry Zone (Spot/Low Leverage): 1.59 – 1.82
Stop Loss: 1.59 (below structure support)
Targets:
Target 1: 2.41 — short-term resistance and first profit-taking zone
Target 2: 4.00 — mid-term target aligned with Fibonacci extension
Target 3: 5.19 — long-term continuation target
Expected Profit Range: ~30% to 170%
RSI (14): Neutral, trending slightly upward — supports steady accumulation
Market Structure: Ascending support trendline with repeated compression under resistance
Bias: Bullish – Long-term accumulation phase likely preceding the next impulsive move
Strategy Notes
This is a spot or low-leverage setup only — ideal for long-term holders or gradual scaling positions.
Watch for volume expansion above 2.4 as a potential breakout confirmation signal.
Break and hold below 1.59 would invalidate this bullish bias.
A clean breakout could trigger continuation similar to the previous 279% move.
ASTER remains in a strong technical position as long as higher lows hold. Long-term investors can consider accumulating gradually within the range while traders watch for breakout confirmation.
DYOR | Not Financial Advice
منشورات ذات صلة
إخلاء المسؤولية
لا يُقصد بالمعلومات والمنشورات أن تكون، أو تشكل، أي نصيحة مالية أو استثمارية أو تجارية أو أنواع أخرى من النصائح أو التوصيات المقدمة أو المعتمدة من TradingView. اقرأ المزيد في شروط الاستخدام.
منشورات ذات صلة
إخلاء المسؤولية
لا يُقصد بالمعلومات والمنشورات أن تكون، أو تشكل، أي نصيحة مالية أو استثمارية أو تجارية أو أنواع أخرى من النصائح أو التوصيات المقدمة أو المعتمدة من TradingView. اقرأ المزيد في شروط الاستخدام.