AUD/JPY (2-hour timeframe), here’s a breakdown of what’s visible
AUD/JPY (2-hour timeframe), here’s a breakdown of what’s visible:
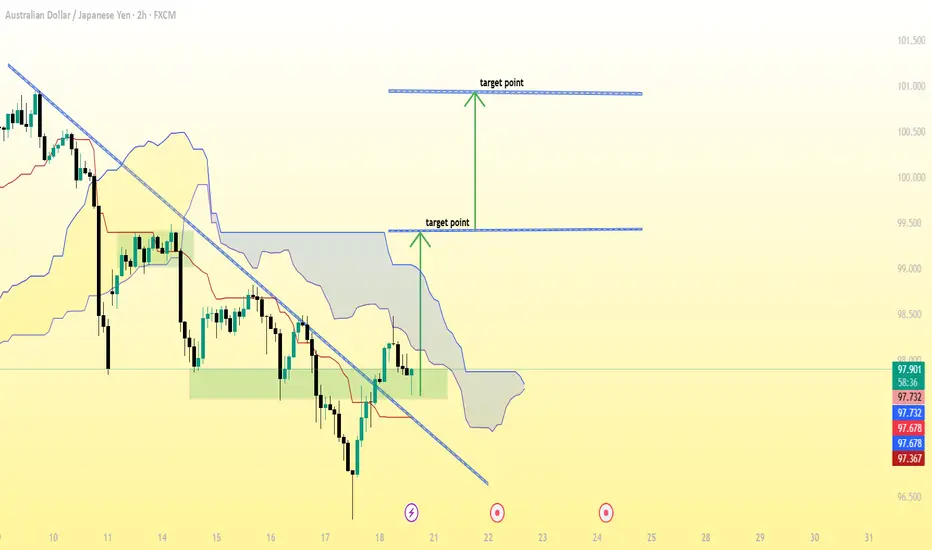
The downtrend line has been broken to the upside, suggesting a potential bullish reversal.
The Ichimoku Cloud shows price moving above or attempting to move above the cloud — another bullish signal.
Two target points are already marked on my chart:
1. First target: around 99.50
2. Second (final) target: around 100.75–101.00
✅ Summary of Target Zones:
🎯 Target 1: ~99.50
🎯 Target 2: ~100.75–101.00
📉 Stop Loss Suggestion:
My might place it just below the recent support or below the cloud (around 97.00–97.20 zone), depending on my risk tolerance.
تم فتح الصفقة
active activeأغلقت الصفقة: تم الوصول للهدف
1st target done منشورات ذات صلة
إخلاء المسؤولية
لا يُقصد بالمعلومات والمنشورات أن تكون، أو تشكل، أي نصيحة مالية أو استثمارية أو تجارية أو أنواع أخرى من النصائح أو التوصيات المقدمة أو المعتمدة من TradingView. اقرأ المزيد في شروط الاستخدام.
منشورات ذات صلة
إخلاء المسؤولية
لا يُقصد بالمعلومات والمنشورات أن تكون، أو تشكل، أي نصيحة مالية أو استثمارية أو تجارية أو أنواع أخرى من النصائح أو التوصيات المقدمة أو المعتمدة من TradingView. اقرأ المزيد في شروط الاستخدام.