"AUD/PLN Technical Analysis – Potential Sell Setup (March 26, 20
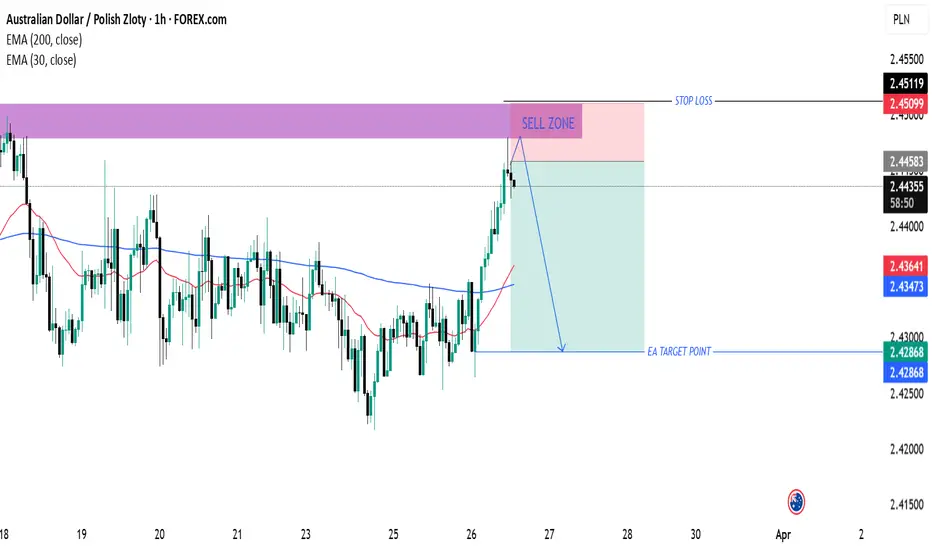
Sell Zone (Purple Area)
This area marks a strong resistance level, where price is expected to reverse downward.
Price has entered this zone, which might indicate a potential short-selling opportunity.
Stop Loss (Above Sell Zone)
The stop-loss level is set at 2.45119, just above the resistance zone.
This protects against a breakout if the price continues upward instead of reversing.
Entry Confirmation
Price action shows a sharp upward movement into the resistance area.
If price starts rejecting this zone (e.g., bearish candlestick patterns like pin bars or engulfing candles), it could confirm a sell entry.
Target Point (Blue Line at 2.42868)
The take-profit level is set at 2.42868, suggesting a downward move if price reverses.
This area might act as the next support zone.
Exponential Moving Averages (EMAs)
30 EMA (Red Line): 2.43595 (Short-term trend indicator).
200 EMA (Blue Line): 2.43464 (Long-term trend indicator).
Price is currently above both EMAs, which suggests a bullish trend, but the resistance zone might trigger a reversal.
Trading Strategy Suggestion
✅ Bearish Setup: Look for rejection signals in the sell zone before entering a short trade.
✅ Risk-Reward Ratio: The stop-loss is tight compared to the potential profit target, making it a favorable setup.
✅ Confirmation Needed: A clear bearish signal (e.g., a strong rejection candle) can increase trade confidence.
أغلقت الصفقة: تم الوصول للهدف
tradingview.com/x/xkF1z0JT/target hitJoin my telegram (COPY_TRADE)
t.me/+4ns23-AkD5RmM2Q0
t.me/+4ns23-AkD5RmM2Q0
Join my refrel broker link
one.exnesstrack.org/a/l1t1rf3p6v
t.me/+4ns23-AkD5RmM2Q0
t.me/+4ns23-AkD5RmM2Q0
Join my refrel broker link
one.exnesstrack.org/a/l1t1rf3p6v
إخلاء المسؤولية
لا يُقصد بالمعلومات والمنشورات أن تكون، أو تشكل، أي نصيحة مالية أو استثمارية أو تجارية أو أنواع أخرى من النصائح أو التوصيات المقدمة أو المعتمدة من TradingView. اقرأ المزيد في شروط الاستخدام.
Join my telegram (COPY_TRADE)
t.me/+4ns23-AkD5RmM2Q0
t.me/+4ns23-AkD5RmM2Q0
Join my refrel broker link
one.exnesstrack.org/a/l1t1rf3p6v
t.me/+4ns23-AkD5RmM2Q0
t.me/+4ns23-AkD5RmM2Q0
Join my refrel broker link
one.exnesstrack.org/a/l1t1rf3p6v
إخلاء المسؤولية
لا يُقصد بالمعلومات والمنشورات أن تكون، أو تشكل، أي نصيحة مالية أو استثمارية أو تجارية أو أنواع أخرى من النصائح أو التوصيات المقدمة أو المعتمدة من TradingView. اقرأ المزيد في شروط الاستخدام.