Time cycles are routines that allow you to map a stock movement by measuring the number of days or periods over which the stocks highs and lows occur. But this does not prove whether a reversal will occur in the next time cycle; it is only a possibility.
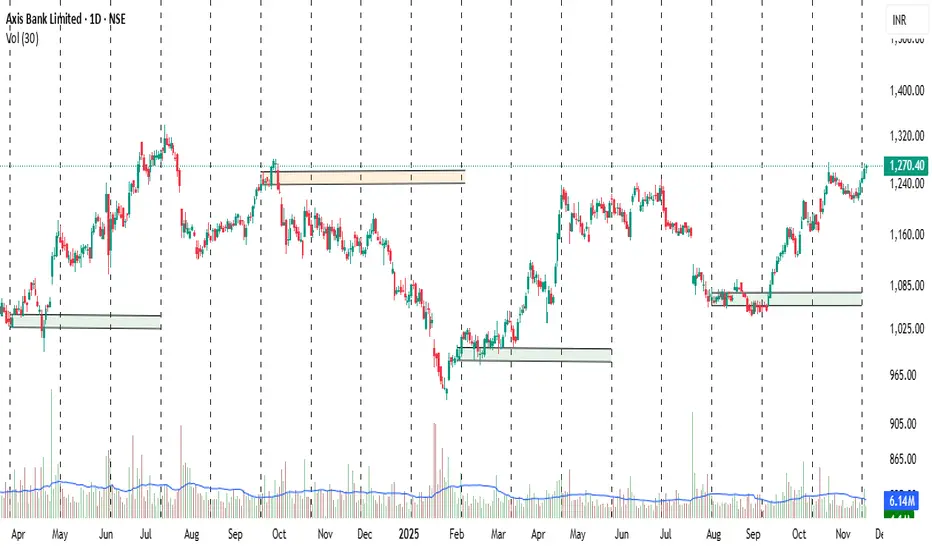
Regardless of the outcome, the candle formed on the day of the Time Cycle holds significant significance. It's crucial that the market respects this candle, whether it moves up or down. The Time Cycle will often pause briefly near the candle. You'll notice on the chart that this often resembles a support or resistance area.
The candle of the time cycle tells you about the continuity or reversal as well, but you have to forgive the high and low of the candle formed on the time cycle.
You do not have to take any decision on your own. This is its specialty.
إخلاء المسؤولية
The information and publications are not meant to be, and do not constitute, financial, investment, trading, or other types of advice or recommendations supplied or endorsed by TradingView. Read more in the Terms of Use.
إخلاء المسؤولية
The information and publications are not meant to be, and do not constitute, financial, investment, trading, or other types of advice or recommendations supplied or endorsed by TradingView. Read more in the Terms of Use.