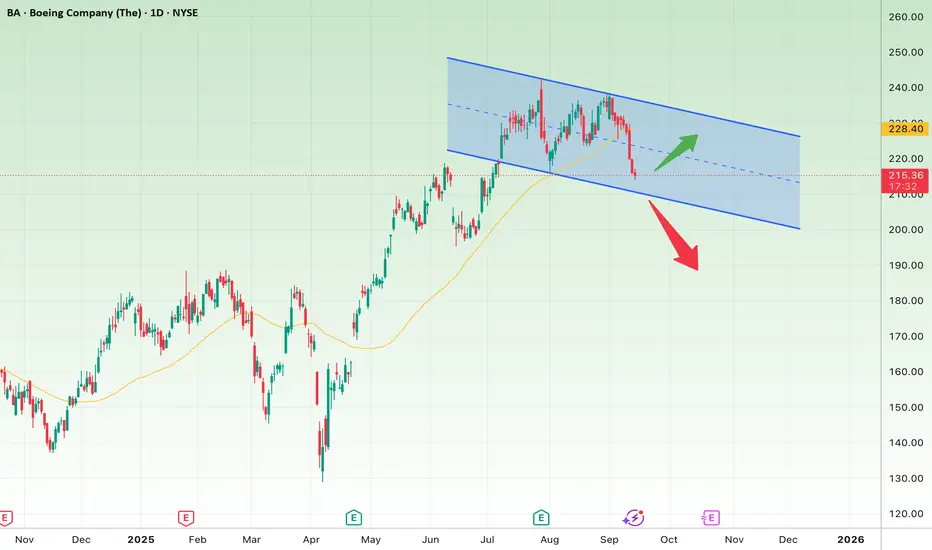
On the daily chart, Boeing (BA) has entered a descending channel after a strong rally from the $175 lows up to around $240 highs.
Bullish Scenario:
The price is currently around $215, near the channel’s lower boundary.
If this support holds and the stock reclaims the 50-day moving average (yellow line around $220), a rebound toward the channel’s upper boundary at $228 – $230 is likely.
A confirmed breakout above the channel could open the way toward $240.
Bearish Scenario:
If the $215 – $210 support zone breaks, the stock could slide down to the channel floor around $200 – $198.
A deeper breakdown below that may trigger further downside toward $185.
Conclusion:
Boeing is in a corrective channel. The $210 – $215 zone is a decisive level:
Holding it = potential rebound and short-term upside.
Breaking it = further weakness and extended downside risk.
إخلاء المسؤولية
لا يُقصد بالمعلومات والمنشورات أن تكون، أو تشكل، أي نصيحة مالية أو استثمارية أو تجارية أو أنواع أخرى من النصائح أو التوصيات المقدمة أو المعتمدة من TradingView. اقرأ المزيد في شروط الاستخدام.
إخلاء المسؤولية
لا يُقصد بالمعلومات والمنشورات أن تكون، أو تشكل، أي نصيحة مالية أو استثمارية أو تجارية أو أنواع أخرى من النصائح أو التوصيات المقدمة أو المعتمدة من TradingView. اقرأ المزيد في شروط الاستخدام.