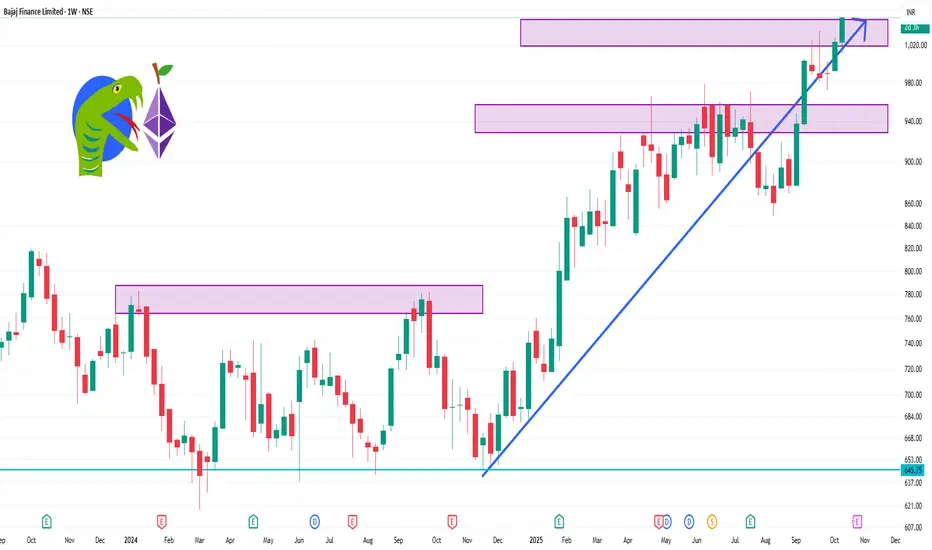
📈 Weekly Technical Levels
Resistance Levels: ₹1,036.75 (short-term), ₹1,023.85 (mid-term)
Support Levels: ₹1,009.85 (short-term), ₹938 (mid-term), ₹816.86 (long-term)
These levels suggest that the stock is trading above its key support zones, indicating a potential continuation of the uptrend.
🔧 Key Technical Indicators
RSI (14): 66.57 — approaching overbought territory, but still room for upward movement.
MACD: 20.92 — indicates bullish momentum.
ADX (14): 31.50 — suggests a strong trend.
Supertrend: ₹973.61 — currently bullish.
Parabolic SAR: ₹982.79 — supports the bullish trend.
Stochastic Oscillator: 84.34 — near overbought levels, indicating potential for a pullback.
Commodity Channel Index (CCI): +131.56 — suggests the stock is overbought.
These indicators collectively point towards a strong bullish trend, though caution is advised as some indicators approach overbought conditions.
منشورات ذات صلة
إخلاء المسؤولية
لا يُقصد بالمعلومات والمنشورات أن تكون، أو تشكل، أي نصيحة مالية أو استثمارية أو تجارية أو أنواع أخرى من النصائح أو التوصيات المقدمة أو المعتمدة من TradingView. اقرأ المزيد في شروط الاستخدام.
منشورات ذات صلة
إخلاء المسؤولية
لا يُقصد بالمعلومات والمنشورات أن تكون، أو تشكل، أي نصيحة مالية أو استثمارية أو تجارية أو أنواع أخرى من النصائح أو التوصيات المقدمة أو المعتمدة من TradingView. اقرأ المزيد في شروط الاستخدام.